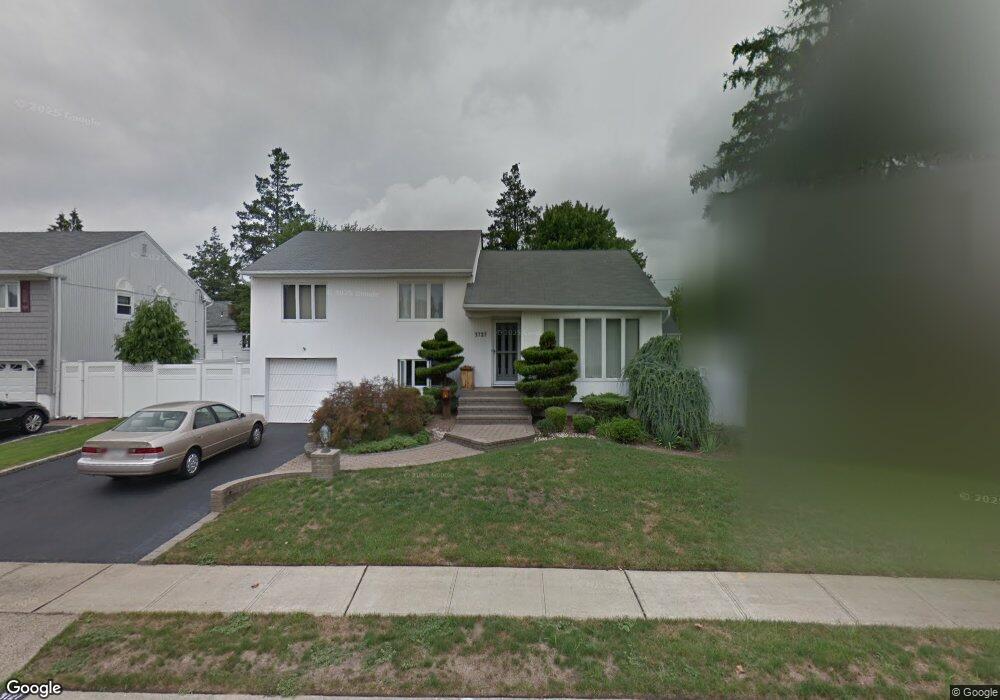
3727 Libby Ln Wantagh, NY 11793
Estimated Value: $858,000 - $872,123
3
Beds
2
Baths
1,500
Sq Ft
$577/Sq Ft
Est. Value
About This Home
This home is located at 3727 Libby Ln, Wantagh, NY 11793 and is currently estimated at $865,062, approximately $576 per square foot. 3727 Libby Ln is a home located in Nassau County with nearby schools including East Broadway School, Jonas E. Salk Middle School, and Gen. Douglas MacArthur Senior High School.
Ownership History
Date
Name
Owned For
Owner Type
Purchase Details
Closed on
Dec 15, 2014
Sold by
Sancilio Felix and Sancilio Theresa
Bought by
Giacoppo Allison and Giacoppo Steven
Current Estimated Value
Home Financials for this Owner
Home Financials are based on the most recent Mortgage that was taken out on this home.
Original Mortgage
$300,000
Outstanding Balance
$230,643
Interest Rate
4.02%
Mortgage Type
Purchase Money Mortgage
Estimated Equity
$634,419
Purchase Details
Closed on
Dec 12, 2014
Sold by
Sancillo Felix and Sancillo Theresa
Bought by
Abrams Joanne and Abrams Thurland
Home Financials for this Owner
Home Financials are based on the most recent Mortgage that was taken out on this home.
Original Mortgage
$300,000
Outstanding Balance
$230,643
Interest Rate
4.02%
Mortgage Type
Purchase Money Mortgage
Estimated Equity
$634,419
Purchase Details
Closed on
Aug 1, 1995
Sold by
Caplan Murray and Caplan Harriet
Bought by
Sancilio Felix and Sancilio Theresa
Create a Home Valuation Report for This Property
The Home Valuation Report is an in-depth analysis detailing your home's value as well as a comparison with similar homes in the area
Home Values in the Area
Average Home Value in this Area
Purchase History
| Date | Buyer | Sale Price | Title Company |
|---|---|---|---|
| Giacoppo Allison | $425,000 | None Available | |
| Abrams Joanne | -- | None Available | |
| Sancilio Felix | $235,000 | -- |
Source: Public Records
Mortgage History
| Date | Status | Borrower | Loan Amount |
|---|---|---|---|
| Open | Giacoppo Allison | $300,000 |
Source: Public Records
Tax History Compared to Growth
Tax History
| Year | Tax Paid | Tax Assessment Tax Assessment Total Assessment is a certain percentage of the fair market value that is determined by local assessors to be the total taxable value of land and additions on the property. | Land | Improvement |
|---|---|---|---|---|
| 2025 | $16,468 | $533 | $226 | $307 |
| 2024 | $3,603 | $533 | $226 | $307 |
| 2023 | $14,649 | $533 | $231 | $302 |
| 2022 | $14,649 | $520 | $226 | $294 |
| 2021 | $13,300 | $550 | $239 | $311 |
| 2020 | $12,534 | $618 | $457 | $161 |
| 2019 | $12,608 | $618 | $429 | $189 |
| 2018 | $10,312 | $659 | $0 | $0 |
| 2017 | $7,595 | $700 | $432 | $268 |
| 2016 | $10,651 | $741 | $411 | $330 |
| 2015 | -- | $782 | $434 | $348 |
| 2014 | -- | $782 | $434 | $348 |
| 2013 | $2,783 | $823 | $457 | $366 |
Source: Public Records
Map
Nearby Homes
- 3715 Regent Ln
- 520 Ann Ln
- 3621 Regent Ln
- 243 Elm Dr S
- 3842 Whitman St
- 17 Rural Ln
- 29 Raspberry Ln
- 9 Redwood Ln
- 6 Regal Ln
- 3651 Woodbridge Ln N
- 341 Red Maple Dr S
- 37 Star Ln
- 3805 Colonial Ct
- 647 Seamans Neck Rd
- 181 Springtime Ln N
- 693 Wantagh Ave
- 59 Springtime Ln S
- 267 Sprucewood Dr
- 126 Swan Ln
- 49 Griddle Ln