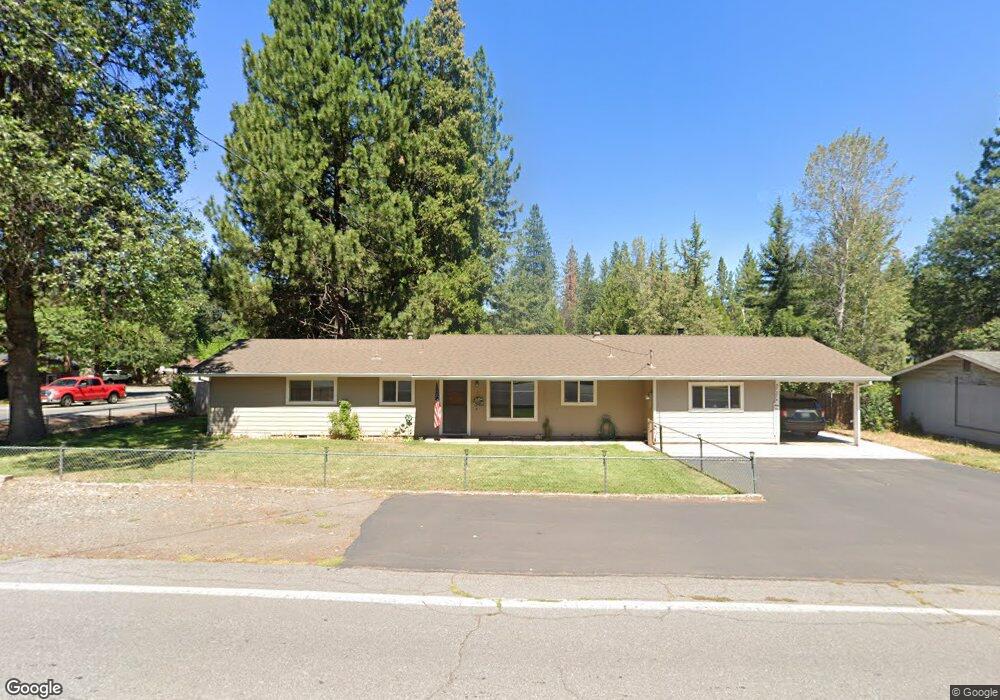
37274 Cypress Ave Burney, CA 96013
Estimated Value: $242,947 - $279,000
3
Beds
2
Baths
1,600
Sq Ft
$159/Sq Ft
Est. Value
About This Home
This home is located at 37274 Cypress Ave, Burney, CA 96013 and is currently estimated at $254,737, approximately $159 per square foot. 37274 Cypress Ave is a home located in Shasta County with nearby schools including Burney Elementary School and Burney Junior/Senior High School.
Ownership History
Date
Name
Owned For
Owner Type
Purchase Details
Closed on
Mar 22, 2021
Sold by
Smith Steven M and Smith Shari G
Bought by
Smith Family 2021 Trust and Smith
Current Estimated Value
Purchase Details
Closed on
Sep 17, 2003
Sold by
Va
Bought by
Smith Steven M and Smith Shari G
Home Financials for this Owner
Home Financials are based on the most recent Mortgage that was taken out on this home.
Original Mortgage
$100,000
Interest Rate
6.22%
Mortgage Type
Purchase Money Mortgage
Create a Home Valuation Report for This Property
The Home Valuation Report is an in-depth analysis detailing your home's value as well as a comparison with similar homes in the area
Home Values in the Area
Average Home Value in this Area
Purchase History
| Date | Buyer | Sale Price | Title Company |
|---|---|---|---|
| Smith Family 2021 Trust | -- | None Listed On Document | |
| Smith Steven M | -- | First American Title |
Source: Public Records
Mortgage History
| Date | Status | Borrower | Loan Amount |
|---|---|---|---|
| Previous Owner | Smith Steven M | $100,000 |
Source: Public Records
Tax History Compared to Growth
Tax History
| Year | Tax Paid | Tax Assessment Tax Assessment Total Assessment is a certain percentage of the fair market value that is determined by local assessors to be the total taxable value of land and additions on the property. | Land | Improvement |
|---|---|---|---|---|
| 2025 | $1,487 | $147,819 | $33,207 | $114,612 |
| 2024 | $1,466 | $144,921 | $32,556 | $112,365 |
| 2023 | $1,466 | $142,080 | $31,918 | $110,162 |
| 2022 | $1,422 | $139,295 | $31,293 | $108,002 |
| 2021 | $1,389 | $136,565 | $30,680 | $105,885 |
| 2020 | $1,384 | $135,166 | $30,366 | $104,800 |
| 2019 | $1,328 | $132,517 | $29,771 | $102,746 |
| 2018 | $1,380 | $129,920 | $29,188 | $100,732 |
| 2017 | $1,308 | $127,373 | $28,616 | $98,757 |
| 2016 | $1,267 | $124,876 | $28,055 | $96,821 |
| 2015 | $1,241 | $123,001 | $27,634 | $95,367 |
| 2014 | $1,225 | $120,592 | $27,093 | $93,499 |
Source: Public Records
Map
Nearby Homes
- 20267 Hudson St
- 37266 Ponderosa Ave
- 37347 Cypress Ave
- 37269 Birch Ave
- 37176 Washburn Ave
- 000 Birch Ave
- 20251 Marquette St
- 37412 Birch Ave
- 20344 Hudson St
- 37424 Birch Ave
- 00000 Long Leaf Ln
- 20194 Sugar Pine St
- 20227 Sugar Pine St
- 011 Kirby Ct
- 007 Kirby Ct
- 010 Kirby Ct
- 20244 Arrowood St
- 20274 Arrowood St
- 37143 California 299
- 20305 Arrowood St
- 37286 Cypress Ave
- 1501 Cypress Ave
- 37298 Cypress Ave
- 20247 Hudson St
- 37285 Cypress Ave
- 20255 Hudson St
- 37297 Cypress Ave
- 20246 Hudson St
- 37310 Cypress Ave
- 20259 Hudson St
- 20260 Lava Flat Rd
- 20254 Hudson St
- 37309 Cypress Ave
- 20258 Hudson St
- 37322 Cypress Ave
- 1484 Grogan St
- 37321 Cypress Ave
- 37217 Park Ave
- 20262 Hudson St
- 20273 Hudson St