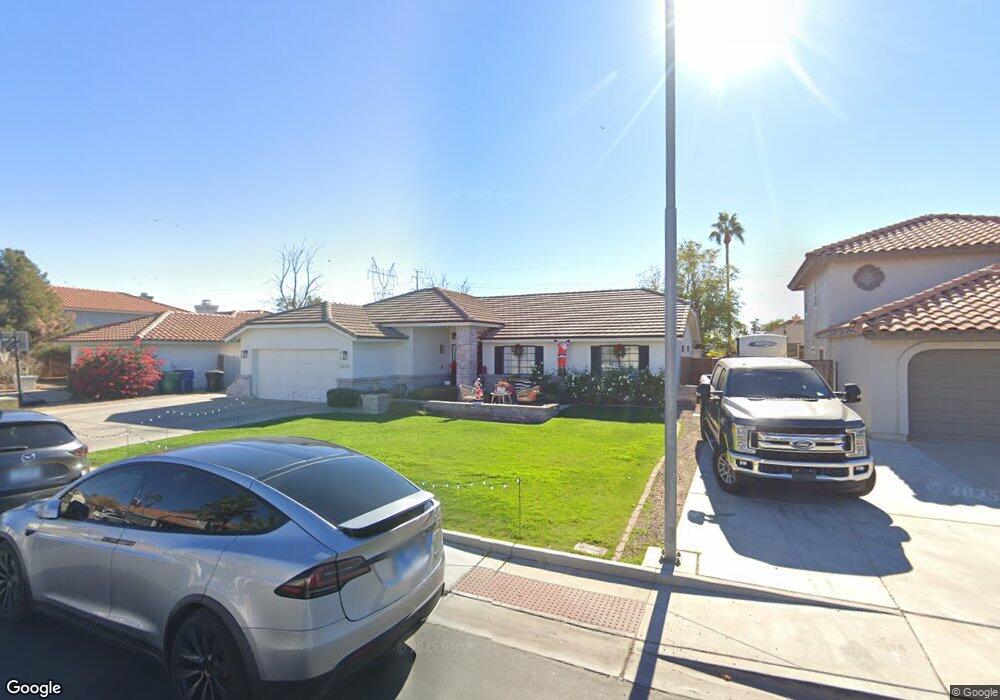
3729 E Dover St Mesa, AZ 85205
The Groves NeighborhoodEstimated Value: $469,427 - $576,000
Studio
3
Baths
1,497
Sq Ft
$355/Sq Ft
Est. Value
About This Home
This home is located at 3729 E Dover St, Mesa, AZ 85205 and is currently estimated at $530,857, approximately $354 per square foot. 3729 E Dover St is a home located in Maricopa County with nearby schools including Entz Elementary School, Franklin at Brimhall Elementary School, and Franklin West Elementary School.
Ownership History
Date
Name
Owned For
Owner Type
Purchase Details
Closed on
Jun 11, 2018
Sold by
Glover Debora A
Bought by
Daley Jack M and Daley Jacki J
Current Estimated Value
Home Financials for this Owner
Home Financials are based on the most recent Mortgage that was taken out on this home.
Original Mortgage
$330,000
Outstanding Balance
$285,395
Interest Rate
4.5%
Mortgage Type
Purchase Money Mortgage
Estimated Equity
$245,462
Purchase Details
Closed on
Mar 22, 2007
Sold by
Glover Troy D
Bought by
Glover Debora Ann
Purchase Details
Closed on
Mar 19, 2007
Sold by
Rock Ronald L and Rock Victoria L
Bought by
Glover Debora Ann
Purchase Details
Closed on
Mar 5, 1998
Sold by
Bates Doris L
Bought by
Rock Ronald L and Rock Victoria L
Purchase Details
Closed on
Jan 5, 1998
Sold by
Bailey Harold W and Bates Doris L
Bought by
Bailey Harold W and Bates Doris L
Create a Home Valuation Report for This Property
The Home Valuation Report is an in-depth analysis detailing your home's value as well as a comparison with similar homes in the area
Home Values in the Area
Average Home Value in this Area
Purchase History
| Date | Buyer | Sale Price | Title Company |
|---|---|---|---|
| Daley Jack M | $330,000 | Chicago Title Agency Inc | |
| Glover Debora Ann | -- | Security Title Agency Inc | |
| Glover Debora Ann | $305,000 | Security Title Agency Inc | |
| Rock Ronald L | $145,000 | First American Title | |
| Bailey Harold W | -- | -- |
Source: Public Records
Mortgage History
| Date | Status | Borrower | Loan Amount |
|---|---|---|---|
| Open | Daley Jack M | $330,000 |
Source: Public Records
Tax History
| Year | Tax Paid | Tax Assessment Tax Assessment Total Assessment is a certain percentage of the fair market value that is determined by local assessors to be the total taxable value of land and additions on the property. | Land | Improvement |
|---|---|---|---|---|
| 2025 | $1,733 | $20,413 | -- | -- |
| 2024 | $1,752 | $19,441 | -- | -- |
| 2023 | $1,752 | $36,680 | $7,330 | $29,350 |
| 2022 | $1,714 | $28,500 | $5,700 | $22,800 |
| 2021 | $1,754 | $27,160 | $5,430 | $21,730 |
| 2020 | $1,730 | $25,080 | $5,010 | $20,070 |
| 2019 | $1,605 | $23,000 | $4,600 | $18,400 |
| 2018 | $1,531 | $21,560 | $4,310 | $17,250 |
| 2017 | $1,483 | $20,300 | $4,060 | $16,240 |
| 2016 | $1,456 | $19,560 | $3,910 | $15,650 |
| 2015 | $1,373 | $18,310 | $3,660 | $14,650 |
Source: Public Records
Map
Nearby Homes
- 3716 E Dartmouth St
- 3746 E Dartmouth St
- 625 N 38th St
- 3721 E Adobe St
- 3716 E University Dr Unit 2014
- 3716 E University Dr Unit 2016
- 3716 E University Dr Unit C2010
- 3637 E Ellis St
- 3739 E Enrose St
- 4021 E Des Moines St
- 3458 E Adobe St
- 4065 E University Dr Unit 433
- 4065 E University Dr Unit 50
- 4065 E University Dr Unit 430
- 4065 E University Dr Unit 136
- 4065 E University Dr Unit 516
- 4065 E University Dr Unit 456
- 4065 E University Dr Unit 344
- 4065 E University Dr Unit 58
- 4065 E University Dr Unit 285
- 3735 E Dover St
- 3721 E Dover St
- 3724 E Decatur St
- 3730 E Decatur St
- 3718 E Decatur St
- 3741 E Dover St
- 3711 E Dover St
- 3728 E Dover St
- 3738 E Dover St
- 3736 E Decatur St
- 3710 E Dover St
- 3747 E Dover St
- 3744 E Dover St
- 3705 E Dover St
- 3742 E Decatur St
- 3706 E Decatur St
- 3706 E Decatur St
- 3733 E Dartmouth St
- 3704 E Dover St
- 3750 E Dover St
Your Personal Tour Guide
Ask me questions while you tour the home.