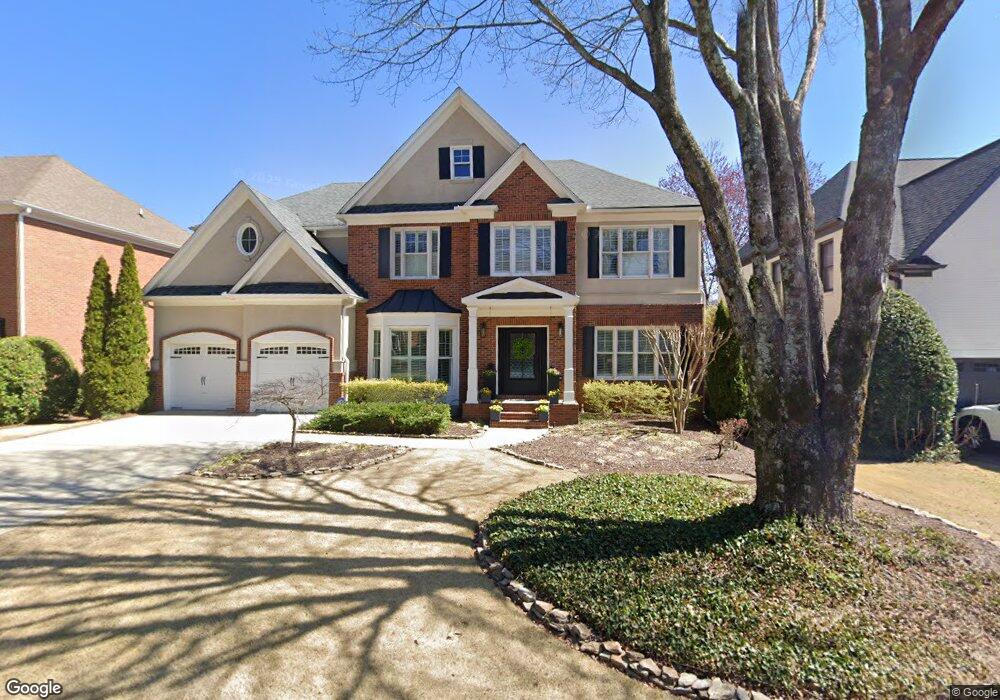
3729 Tynemoore Trace SE Smyrna, GA 30080
Estimated Value: $827,000 - $1,084,000
5
Beds
5
Baths
4,404
Sq Ft
$221/Sq Ft
Est. Value
About This Home
This home is located at 3729 Tynemoore Trace SE, Smyrna, GA 30080 and is currently estimated at $974,085, approximately $221 per square foot. 3729 Tynemoore Trace SE is a home located in Cobb County with nearby schools including Teasley Elementary School, Campbell Middle School, and Campbell High School.
Ownership History
Date
Name
Owned For
Owner Type
Purchase Details
Closed on
Nov 30, 2000
Sold by
Belongea William R and Belongea Jamie L
Bought by
Jindia Rajiv K and Jindia Gunjan K
Current Estimated Value
Home Financials for this Owner
Home Financials are based on the most recent Mortgage that was taken out on this home.
Original Mortgage
$320,000
Outstanding Balance
$116,483
Interest Rate
7.71%
Mortgage Type
New Conventional
Estimated Equity
$857,602
Purchase Details
Closed on
May 15, 1998
Sold by
Peachtree Residential Properties Inc
Bought by
Belongea William R and Belongea Jamie L
Home Financials for this Owner
Home Financials are based on the most recent Mortgage that was taken out on this home.
Original Mortgage
$227,150
Interest Rate
7.04%
Mortgage Type
New Conventional
Create a Home Valuation Report for This Property
The Home Valuation Report is an in-depth analysis detailing your home's value as well as a comparison with similar homes in the area
Home Values in the Area
Average Home Value in this Area
Purchase History
| Date | Buyer | Sale Price | Title Company |
|---|---|---|---|
| Jindia Rajiv K | $400,000 | -- | |
| Belongea William R | $351,900 | -- |
Source: Public Records
Mortgage History
| Date | Status | Borrower | Loan Amount |
|---|---|---|---|
| Open | Jindia Rajiv K | $320,000 | |
| Previous Owner | Belongea William R | $227,150 |
Source: Public Records
Tax History Compared to Growth
Tax History
| Year | Tax Paid | Tax Assessment Tax Assessment Total Assessment is a certain percentage of the fair market value that is determined by local assessors to be the total taxable value of land and additions on the property. | Land | Improvement |
|---|---|---|---|---|
| 2025 | $7,231 | $300,000 | $56,000 | $244,000 |
| 2024 | $7,237 | $300,000 | $56,000 | $244,000 |
| 2023 | $7,450 | $334,844 | $56,000 | $278,844 |
| 2022 | $6,696 | $272,656 | $48,000 | $224,656 |
| 2021 | $6,696 | $272,656 | $48,000 | $224,656 |
| 2020 | $5,761 | $229,906 | $43,200 | $186,706 |
| 2019 | $6,320 | $255,452 | $48,000 | $207,452 |
| 2018 | $6,320 | $255,452 | $48,000 | $207,452 |
| 2017 | $5,497 | $225,264 | $48,000 | $177,264 |
| 2016 | $5,509 | $225,264 | $48,000 | $177,264 |
| 2015 | $5,615 | $225,264 | $48,000 | $177,264 |
| 2014 | $5,108 | $201,148 | $0 | $0 |
Source: Public Records
Map
Nearby Homes
- 1914 Tynemoore Ct SE
- 3703 Tynemoore Trace SE
- 4097 Gilmore Rd SE
- 2133 Lucerne Ln SE
- 4089 Thorndale Ln SE Unit 13
- 3927 Pineview Dr SE
- 2150 Whitestone Ct SE
- 2027 Cooper Lake Dr SE
- 3974 Basque Cir SE
- 3916 Ridgewood Dr SE
- 4204 Norbury Ct SE
- 2295 Falmouth Ct SE Unit 23
- 2291 Falmouth Ct SE Unit 23
- 2105 Monhegan Way SE Unit 13
- 1982 Cheyanne Dr SE
- 3854 Ridgewood Dr SE
- 2282 McLean Chase SE
- 3721 Paces Park Cir SE
- 4059 Vinings Mill Trail SE
- 3731 Tynemoore Trace SE
- 3727 Tynemoore Trace SE
- 3808 Tynemoore Walk SE
- 3810 Tynemoore Walk SE
- 3733 Tynemoore Trace SE
- 3725 Tynemoore Trace SE
- 3728 Tynemoore Trace SE
- 3812 Tynemoore Walk SE
- 3806 Tynemoore Walk SE
- 3726 Tynemoore Trace SE
- 3814 Tynemoore Walk SE
- 3735 Tynemoore Trace SE
- 3724 Tynemoore Trace SE
- 3723 Tynemoore Trace SE
- 1915 Tynemoore Ct SE
- 3871 Tynemoore Walk SE
- 3734 Tynemoore Trace SE
- 3722 Tynemoore Trace SE
- 3816 Tynemoore Walk SE
- 3721 Tynemoore Trace SE