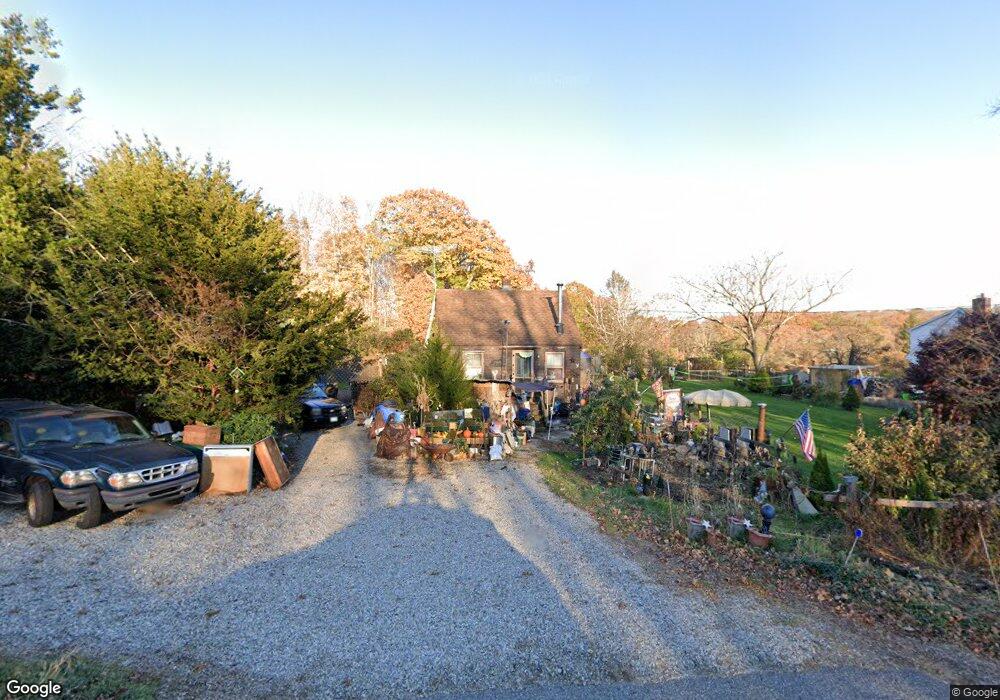
373 Hebron Rd Andover, CT 06232
Estimated Value: $145,287 - $375,000
2
Beds
1
Bath
653
Sq Ft
$419/Sq Ft
Est. Value
About This Home
This home is located at 373 Hebron Rd, Andover, CT 06232 and is currently estimated at $273,822, approximately $419 per square foot. 373 Hebron Rd is a home located in Tolland County with nearby schools including Andover Elementary School, RHAM Middle School, and RHAM High School.
Ownership History
Date
Name
Owned For
Owner Type
Purchase Details
Closed on
Nov 30, 2010
Sold by
Kukucka Lucille
Bought by
Kukucka Carol
Current Estimated Value
Purchase Details
Closed on
Jan 27, 2009
Sold by
Kukucka Charles
Bought by
Kukucka Lucille
Purchase Details
Closed on
Apr 25, 1995
Sold by
Moore James
Bought by
Anderson David and Taurgee Sharmon
Home Financials for this Owner
Home Financials are based on the most recent Mortgage that was taken out on this home.
Original Mortgage
$118,700
Interest Rate
8.55%
Purchase Details
Closed on
Nov 2, 1992
Sold by
Mtn View Ests
Bought by
Moore James
Home Financials for this Owner
Home Financials are based on the most recent Mortgage that was taken out on this home.
Original Mortgage
$125,000
Interest Rate
8.3%
Create a Home Valuation Report for This Property
The Home Valuation Report is an in-depth analysis detailing your home's value as well as a comparison with similar homes in the area
Home Values in the Area
Average Home Value in this Area
Purchase History
| Date | Buyer | Sale Price | Title Company |
|---|---|---|---|
| Kukucka Carol | -- | -- | |
| Kukucka Carol | -- | -- | |
| Kukucka Lucille | -- | -- | |
| Kukucka Lucille | -- | -- | |
| Anderson David | $125,000 | -- | |
| Anderson David | $125,000 | -- | |
| Moore James | $134,900 | -- |
Source: Public Records
Mortgage History
| Date | Status | Borrower | Loan Amount |
|---|---|---|---|
| Previous Owner | Moore James | $118,700 | |
| Previous Owner | Moore James | $125,000 |
Source: Public Records
Tax History Compared to Growth
Tax History
| Year | Tax Paid | Tax Assessment Tax Assessment Total Assessment is a certain percentage of the fair market value that is determined by local assessors to be the total taxable value of land and additions on the property. | Land | Improvement |
|---|---|---|---|---|
| 2025 | $1,950 | $61,740 | $34,930 | $26,810 |
| 2024 | $1,942 | $61,740 | $34,930 | $26,810 |
| 2023 | $1,932 | $61,740 | $34,930 | $26,810 |
| 2022 | $1,970 | $61,740 | $34,930 | $26,810 |
| 2021 | $2,570 | $71,400 | $45,700 | $25,700 |
| 2020 | $2,592 | $72,800 | $45,700 | $27,100 |
| 2019 | $2,547 | $72,800 | $45,700 | $27,100 |
| 2018 | $2,472 | $72,800 | $45,700 | $27,100 |
| 2017 | $2,366 | $72,800 | $45,700 | $27,100 |
| 2016 | $2,230 | $72,600 | $45,700 | $26,900 |
| 2015 | $2,230 | $72,600 | $45,700 | $26,900 |
| 2014 | $2,230 | $72,600 | $45,700 | $26,900 |
Source: Public Records
Map
Nearby Homes
- 239 Lake Rd
- 74 Erdoni Rd
- 35 Basket Shop Rd
- 43 Route 87
- 10 Lakeview Park
- 127 Route 87
- 249 Wall St
- 0 Us Highway 6
- 78 Hennequin Rd
- 222 Gilead St
- 00 Bunker Hill Rd
- 64 Loveland Rd
- 559 East St
- 44 Route 6
- 0 Wells Wood Rd Unit 24118855
- 78 Bear Swamp Rd
- 0 Wheeling Rd Unit 24116879
- 0 Hunt Rd
- 65 Wellswood Rd
- 41 Oakwood Ln