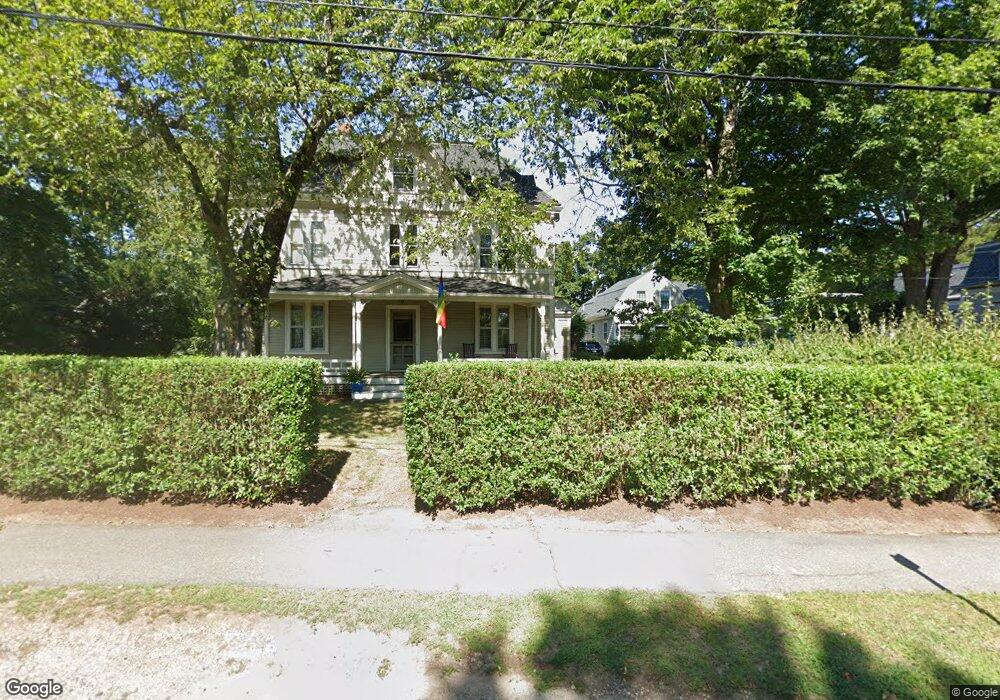
373 Main St Hingham, MA 02043
Estimated Value: $2,049,000 - $2,152,000
4
Beds
4
Baths
4,313
Sq Ft
$487/Sq Ft
Est. Value
About This Home
This home is located at 373 Main St, Hingham, MA 02043 and is currently estimated at $2,100,538, approximately $487 per square foot. 373 Main St is a home located in Plymouth County with nearby schools including East Elementary School, Hingham Middle School, and Hingham High School.
Ownership History
Date
Name
Owned For
Owner Type
Purchase Details
Closed on
Jul 31, 2003
Sold by
Pimental Daniel L
Bought by
Nielsen Anton I and Nielsen Christine K
Current Estimated Value
Home Financials for this Owner
Home Financials are based on the most recent Mortgage that was taken out on this home.
Original Mortgage
$684,000
Outstanding Balance
$293,738
Interest Rate
5.28%
Mortgage Type
Purchase Money Mortgage
Estimated Equity
$1,806,800
Purchase Details
Closed on
Dec 19, 2001
Sold by
Marchesiani Tr Mary M and Marchesiani Nancy E
Bought by
Hingham Resources Llc
Home Financials for this Owner
Home Financials are based on the most recent Mortgage that was taken out on this home.
Original Mortgage
$460,000
Interest Rate
6.54%
Mortgage Type
Purchase Money Mortgage
Purchase Details
Closed on
May 15, 2000
Sold by
Snape Robert A and Snape Melissa F
Bought by
Pimental Daniel L
Purchase Details
Closed on
Jul 16, 1998
Sold by
Horner Judson S and Horner Alice F
Bought by
Snape Robert A and Snape Melissa F
Purchase Details
Closed on
Dec 14, 1990
Sold by
Est Curran Walter E
Bought by
Horner Judson S
Create a Home Valuation Report for This Property
The Home Valuation Report is an in-depth analysis detailing your home's value as well as a comparison with similar homes in the area
Purchase History
| Date | Buyer | Sale Price | Title Company |
|---|---|---|---|
| Nielsen Anton I | $855,000 | -- | |
| Hingham Resources Llc | $1,400,000 | -- | |
| Pimental Daniel L | $809,000 | -- | |
| Snape Robert A | $540,000 | -- | |
| Horner Judson S | $280,000 | -- |
Source: Public Records
Mortgage History
| Date | Status | Borrower | Loan Amount |
|---|---|---|---|
| Open | Horner Judson S | $417,000 | |
| Open | Horner Judson S | $684,000 | |
| Previous Owner | Horner Judson S | $460,000 |
Source: Public Records
Tax History
| Year | Tax Paid | Tax Assessment Tax Assessment Total Assessment is a certain percentage of the fair market value that is determined by local assessors to be the total taxable value of land and additions on the property. | Land | Improvement |
|---|---|---|---|---|
| 2025 | $17,940 | $1,678,200 | $704,000 | $974,200 |
| 2024 | $17,984 | $1,657,500 | $704,000 | $953,500 |
| 2023 | $16,286 | $1,628,600 | $704,000 | $924,600 |
| 2022 | $15,990 | $1,383,200 | $606,800 | $776,400 |
| 2021 | $15,980 | $1,354,200 | $606,800 | $747,400 |
| 2020 | $15,614 | $1,354,200 | $606,800 | $747,400 |
| 2019 | $15,847 | $1,341,800 | $606,800 | $735,000 |
| 2018 | $13,361 | $1,135,200 | $606,800 | $528,400 |
| 2017 | $12,942 | $1,056,500 | $606,800 | $449,700 |
| 2016 | $12,836 | $1,027,700 | $578,000 | $449,700 |
| 2015 | $12,762 | $1,018,500 | $568,800 | $449,700 |
Source: Public Records
Map
Nearby Homes
Your Personal Tour Guide
Ask me questions while you tour the home.