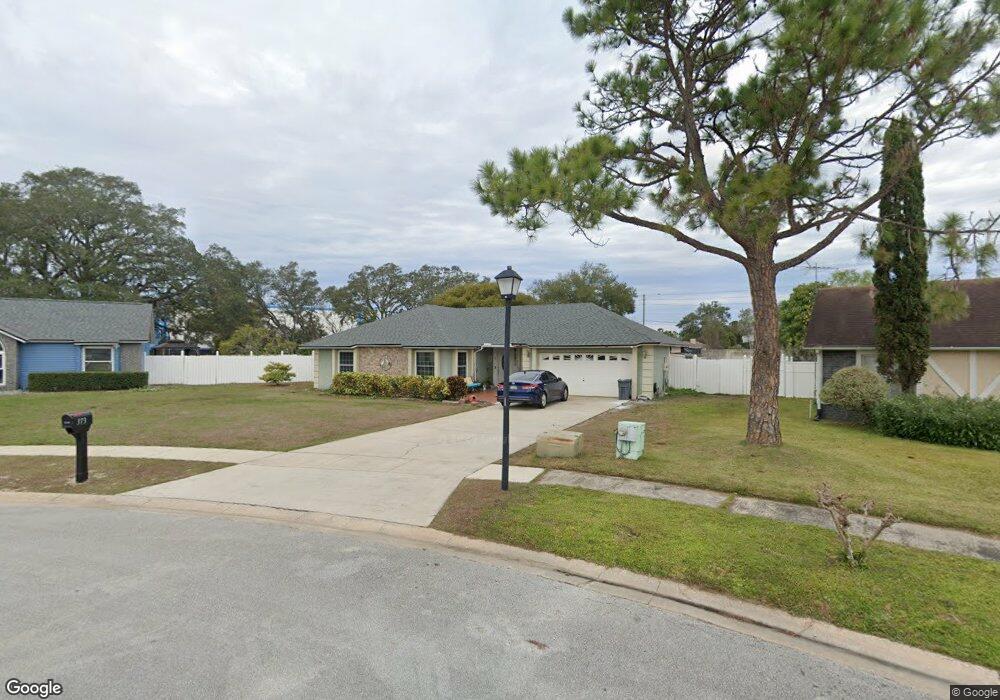
373 Red Rose Cir Orlando, FL 32835
Estimated Value: $357,000 - $376,087
3
Beds
2
Baths
1,536
Sq Ft
$239/Sq Ft
Est. Value
About This Home
This home is located at 373 Red Rose Cir, Orlando, FL 32835 and is currently estimated at $367,272, approximately $239 per square foot. 373 Red Rose Cir is a home located in Orange County with nearby schools including William Frangus Elementary School, Gotha Middle School, and Olympia High.
Ownership History
Date
Name
Owned For
Owner Type
Purchase Details
Closed on
Sep 15, 1997
Sold by
Quezada Francisco M and Quezada Ramona
Bought by
Quezada Rafaela M
Current Estimated Value
Home Financials for this Owner
Home Financials are based on the most recent Mortgage that was taken out on this home.
Original Mortgage
$76,500
Outstanding Balance
$11,772
Interest Rate
7.39%
Mortgage Type
Balloon
Estimated Equity
$355,500
Purchase Details
Closed on
Dec 6, 1995
Sold by
Nosowicz Kevin A and Nosowicz Nancy A
Bought by
Quezada Francisco M and Quezada Ramona
Home Financials for this Owner
Home Financials are based on the most recent Mortgage that was taken out on this home.
Original Mortgage
$65,000
Interest Rate
7.4%
Mortgage Type
New Conventional
Purchase Details
Closed on
Oct 29, 1993
Sold by
Cooper Gary W and Cooper Kathleen M
Bought by
Nosowicz Kevin A and Nosowicz Nancy A
Home Financials for this Owner
Home Financials are based on the most recent Mortgage that was taken out on this home.
Original Mortgage
$84,975
Interest Rate
7.03%
Mortgage Type
FHA
Create a Home Valuation Report for This Property
The Home Valuation Report is an in-depth analysis detailing your home's value as well as a comparison with similar homes in the area
Home Values in the Area
Average Home Value in this Area
Purchase History
| Date | Buyer | Sale Price | Title Company |
|---|---|---|---|
| Quezada Rafaela M | $90,000 | -- | |
| Quezada Francisco M | $93,100 | -- | |
| Nosowicz Kevin A | $92,500 | -- |
Source: Public Records
Mortgage History
| Date | Status | Borrower | Loan Amount |
|---|---|---|---|
| Open | Quezada Francisco M | $28,657 | |
| Open | Quezada Francisco M | $76,500 | |
| Previous Owner | Quezada Francisco M | $65,000 | |
| Previous Owner | Nosowicz Kevin A | $84,975 |
Source: Public Records
Tax History Compared to Growth
Tax History
| Year | Tax Paid | Tax Assessment Tax Assessment Total Assessment is a certain percentage of the fair market value that is determined by local assessors to be the total taxable value of land and additions on the property. | Land | Improvement |
|---|---|---|---|---|
| 2025 | $2,131 | $141,997 | -- | -- |
| 2024 | $1,982 | $141,997 | -- | -- |
| 2023 | $1,982 | $133,976 | $0 | $0 |
| 2022 | $1,872 | $130,074 | $0 | $0 |
| 2021 | $1,832 | $126,285 | $0 | $0 |
| 2020 | $1,739 | $124,541 | $0 | $0 |
| 2019 | $1,777 | $121,741 | $0 | $0 |
| 2018 | $1,738 | $119,471 | $0 | $0 |
| 2017 | $1,704 | $157,265 | $28,000 | $129,265 |
| 2016 | $1,669 | $146,832 | $25,000 | $121,832 |
| 2015 | $1,689 | $140,716 | $25,000 | $115,716 |
| 2014 | $1,721 | $128,103 | $35,000 | $93,103 |
Source: Public Records
Map
Nearby Homes
- 117 Red Rose Cir
- 142 Grove St
- 101 Grove St
- 286 Mileham Dr
- 546 Wheatstone Place
- 502 S Apopka Vineland Rd
- 551 Wheatstone Place
- 119 Killington Way
- 8076 Aspencrest Ct
- 8202 Windsor Ridge Rd
- 7748 Pengrove Pass
- 7818 Kensingham Ct
- 232 Sandpiper Ridge Dr
- 408 Sandpiper Ridge Dr Unit IVD
- 352 Ashbourne Dr
- 7717 Pineapple Dr
- 7632 Pacific Heights Cir
- 7606 Brisbane Ct
- 107 Lake Darby Place
- 9237 Lake Lotta Cir
- 379 Red Rose Cir
- 367 Red Rose Cir
- 385 Red Rose Cir
- 361 Red Rose Cir
- 380 Red Rose Cir
- 355 Red Rose Cir
- 451 Friendship Dr
- 100 Red Rose Cir
- 8516 Old Winter Garden Rd
- 8516 Old Winter Garden Rd Unit 100
- 8516 Old Winter Garden Rd Unit 202
- 348 Red Rose Cir
- 349 Red Rose Cir
- 457 Friendship Dr
- 106 Red Rose Cir
- 342 Red Rose Cir
- 343 Red Rose Cir
- 112 Red Rose Cir
- 0 Old Winter Garden Rd Unit O4912305
- 0 Old Winter Garden Rd Unit O5966406