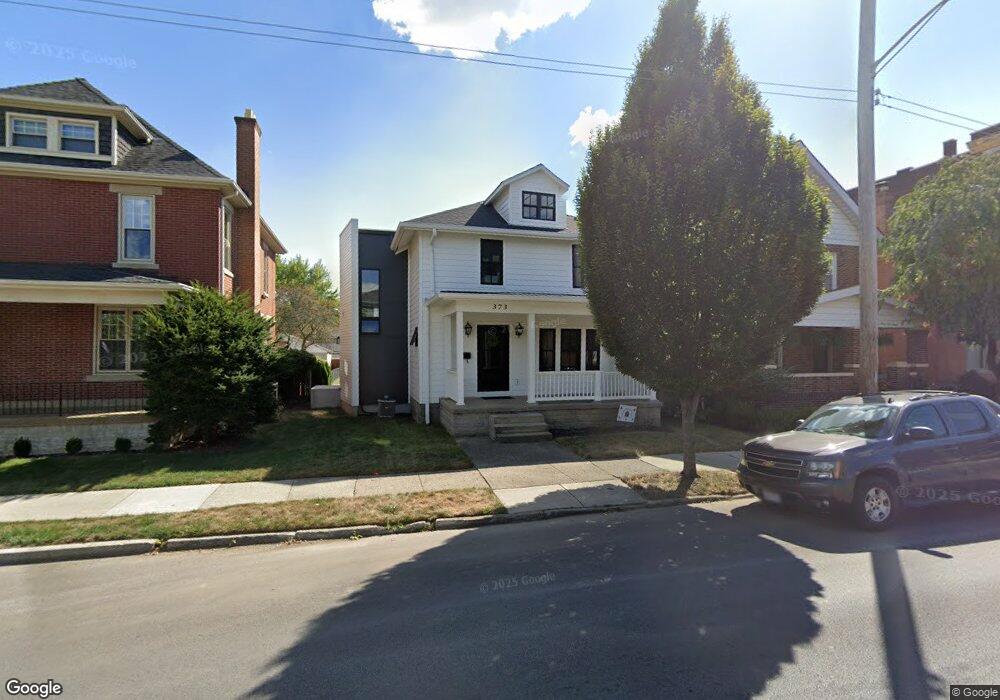
373 Thurman Ave Columbus, OH 43206
Merion Village NeighborhoodEstimated Value: $570,000 - $800,000
4
Beds
3
Baths
2,516
Sq Ft
$272/Sq Ft
Est. Value
About This Home
This home is located at 373 Thurman Ave, Columbus, OH 43206 and is currently estimated at $685,488, approximately $272 per square foot. 373 Thurman Ave is a home located in Franklin County with nearby schools including Siebert Elementary School, South High School, and South Columbus Preparatory Academy.
Ownership History
Date
Name
Owned For
Owner Type
Purchase Details
Closed on
Jun 30, 2020
Sold by
Thomas Patricia S and Thomas Norwood D
Bought by
Thomas Miles and Thomas Monica
Current Estimated Value
Home Financials for this Owner
Home Financials are based on the most recent Mortgage that was taken out on this home.
Original Mortgage
$320,000
Outstanding Balance
$283,755
Interest Rate
3.1%
Mortgage Type
New Conventional
Estimated Equity
$401,733
Purchase Details
Closed on
May 31, 2013
Sold by
Thomas Patricia S
Bought by
Thomas Patricia S and Thomas Norwood D
Purchase Details
Closed on
Jun 25, 1998
Sold by
Payne Donald A and Payne Eula A
Bought by
Thomas Patricia S
Home Financials for this Owner
Home Financials are based on the most recent Mortgage that was taken out on this home.
Original Mortgage
$91,258
Interest Rate
7.05%
Mortgage Type
FHA
Purchase Details
Closed on
Sep 2, 1993
Purchase Details
Closed on
Jun 1, 1986
Create a Home Valuation Report for This Property
The Home Valuation Report is an in-depth analysis detailing your home's value as well as a comparison with similar homes in the area
Home Values in the Area
Average Home Value in this Area
Purchase History
| Date | Buyer | Sale Price | Title Company |
|---|---|---|---|
| Thomas Miles | $340,000 | Omni Title Llc | |
| Thomas Patricia S | -- | None Available | |
| Thomas Patricia S | $71,500 | Superior Title Svcs Agency I | |
| -- | -- | -- | |
| -- | $34,500 | -- |
Source: Public Records
Mortgage History
| Date | Status | Borrower | Loan Amount |
|---|---|---|---|
| Open | Thomas Miles | $320,000 | |
| Closed | Thomas Patricia S | $91,258 |
Source: Public Records
Tax History Compared to Growth
Tax History
| Year | Tax Paid | Tax Assessment Tax Assessment Total Assessment is a certain percentage of the fair market value that is determined by local assessors to be the total taxable value of land and additions on the property. | Land | Improvement |
|---|---|---|---|---|
| 2024 | $7,842 | $174,730 | $57,510 | $117,220 |
| 2023 | $5,664 | $127,820 | $57,505 | $70,315 |
| 2022 | $5,507 | $106,190 | $43,260 | $62,930 |
| 2021 | $5,517 | $106,190 | $43,260 | $62,930 |
| 2020 | $5,524 | $106,190 | $43,260 | $62,930 |
| 2019 | $5,194 | $85,620 | $61,780 | $23,840 |
| 2018 | $4,745 | $85,620 | $61,780 | $23,840 |
| 2017 | $4,967 | $85,620 | $61,780 | $23,840 |
| 2016 | $4,744 | $71,610 | $24,500 | $47,110 |
| 2015 | $4,306 | $71,610 | $24,500 | $47,110 |
| 2014 | $4,317 | $71,610 | $24,500 | $47,110 |
| 2013 | $1,936 | $65,100 | $22,260 | $42,840 |
Source: Public Records
Map
Nearby Homes
- 320 E Mithoff St
- 389 E Mithoff St
- 1218 Bruck St
- 1252 Parsons Ave
- 325 Frebis Ave
- 195 E Mithoff St Unit 195
- 515 E Mithoff St
- 1274 Wager St
- 348-350 E Moler St
- 1106-1116 Parsons Ave
- 1178 Wager St
- 531 E Deshler Ave
- 520 Cline St
- 154-156 E Gates St
- 565 E Mithoff St
- 144 E Mithoff St
- 523 Hanford St
- 479 Siebert St
- 524 Thurman Ave
- 164 Frebis Ave
- 367 Thurman Ave
- 379 Thurman Ave
- 378 Thurman Ave
- 382 Thurman Ave
- 383 Thurman Ave
- 389 Thurman Ave
- 372 Thurman Ave
- 363 Thurman Ave
- 363 Thurman Ave
- 390 Thurman Ave
- 393 Thurman Ave
- 394 Thurman Ave
- 386 Thurman Ave
- 398 Thurman Ave
- 402 Thurman Ave
- 345 Thurman Ave
- 399 Thurman Ave
- 335 Thurman Ave
- 362 E Mithoff St Unit 364
- 360 E Mithoff St