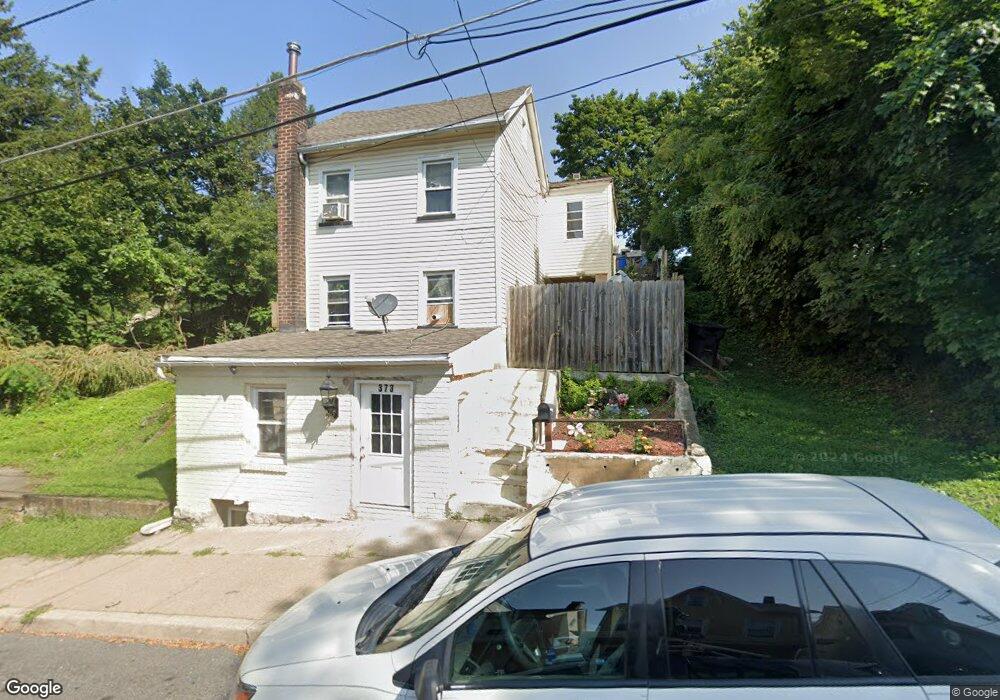
373 W Nesquehoning St Easton, PA 18042
Southside Easton NeighborhoodEstimated Value: $240,000 - $263,000
3
Beds
2
Baths
1,692
Sq Ft
$149/Sq Ft
Est. Value
About This Home
This home is located at 373 W Nesquehoning St, Easton, PA 18042 and is currently estimated at $252,000, approximately $148 per square foot. 373 W Nesquehoning St is a home located in Northampton County with nearby schools including Cheston Elementary School, Easton Area Middle School, and Easton Area High School.
Ownership History
Date
Name
Owned For
Owner Type
Purchase Details
Closed on
Nov 20, 2019
Sold by
Koller William
Bought by
Cruz Juan J
Current Estimated Value
Purchase Details
Closed on
Sep 14, 2015
Sold by
Kurtz Michael
Bought by
Cruz Juan Jose
Purchase Details
Closed on
Aug 24, 2015
Sold by
Pinacle Trust Services
Bought by
Kurtz Michael
Purchase Details
Closed on
Nov 5, 2009
Sold by
Innomax Solutions Llc
Bought by
0373 Nesquehong Trust and Pinnacle Trust Services
Purchase Details
Closed on
May 7, 2009
Sold by
National Asset Management Group Inc
Bought by
Innomax Solutions Llc
Purchase Details
Closed on
Sep 26, 2008
Sold by
Wm Specialty Mortgage Llc
Bought by
National Asset Management Group Inc
Purchase Details
Closed on
Jun 20, 2008
Sold by
Hawbecker Jeffrey K
Bought by
Wm Specialty Mortgage Llc
Create a Home Valuation Report for This Property
The Home Valuation Report is an in-depth analysis detailing your home's value as well as a comparison with similar homes in the area
Home Values in the Area
Average Home Value in this Area
Purchase History
| Date | Buyer | Sale Price | Title Company |
|---|---|---|---|
| Cruz Juan J | $9,000 | Mount Bethel Abstract Inc | |
| Cruz Juan Jose | $8,500 | None Available | |
| Kurtz Michael | $3,800 | None Available | |
| 0373 Nesquehong Trust | -- | None Available | |
| Innomax Solutions Llc | $8,200 | Cornerstone Title Services L | |
| National Asset Management Group Inc | $7,000 | None Available | |
| Wm Specialty Mortgage Llc | -- | None Available |
Source: Public Records
Tax History Compared to Growth
Tax History
| Year | Tax Paid | Tax Assessment Tax Assessment Total Assessment is a certain percentage of the fair market value that is determined by local assessors to be the total taxable value of land and additions on the property. | Land | Improvement |
|---|---|---|---|---|
| 2025 | $346 | $32,000 | $12,900 | $19,100 |
| 2024 | $3,320 | $32,000 | $12,900 | $19,100 |
| 2023 | $3,320 | $32,000 | $12,900 | $19,100 |
| 2022 | $2,253 | $22,000 | $12,900 | $9,100 |
| 2021 | $2,247 | $22,000 | $12,900 | $9,100 |
| 2020 | $2,246 | $22,000 | $12,900 | $9,100 |
| 2019 | $2,220 | $22,000 | $12,900 | $9,100 |
| 2018 | $2,188 | $22,000 | $12,900 | $9,100 |
| 2017 | $2,145 | $22,000 | $12,900 | $9,100 |
| 2016 | -- | $22,000 | $12,900 | $9,100 |
| 2015 | -- | $22,000 | $12,900 | $9,100 |
| 2014 | -- | $22,000 | $12,900 | $9,100 |
Source: Public Records
Map
Nearby Homes
- 354 W Saint Joseph St
- 351 W Wilkes Barre St
- 425 W Wilkes Barre St
- 249 W Nesquehoning St
- 270 W Wilkes Barre St
- 304 W Canal St
- 245 W Nesquehoning St
- 419 W Lincoln St
- 425 W Lincoln St
- 161 W Wilkes Barre St
- 541 W Wilkes Barre St
- 606 W Nesquehoning St
- 495 W Berwick St
- 521 Reynolds St
- 404 Centre St
- 533 Reynolds St
- 115 E Wilkes Barre St
- 133 E Nesquehoning St
- 137 E Nesquehoning St
- 820 Philadelphia Rd
- 359 W Nesquehoning St
- 357 W Nesquehoning St
- 355 W Nesquehoning St
- 378 W Saint Joseph St
- 382 W Saint Joseph St
- 360 W Saint Joseph St
- 351 W Nesquehoning St
- 372 W Nesquehoning St
- 386 W Saint Joseph St
- 378 W Nesquehoning St
- 370 W Nesquehoning St
- 358 W Saint Joseph St
- 380 W Nesquehoning St
- 362 W Nesquehoning St
- 397 W Nesquehoning St
- 358 W Nesquehoning St
- 349 W Nesquehoning St
- 352 W Saint Joseph St
- 390 W Saint Joseph St
- 356 W Nesquehoning St