3731 E Market St Logansport, IN 46947
Estimated payment $2,562/month
About This Lot
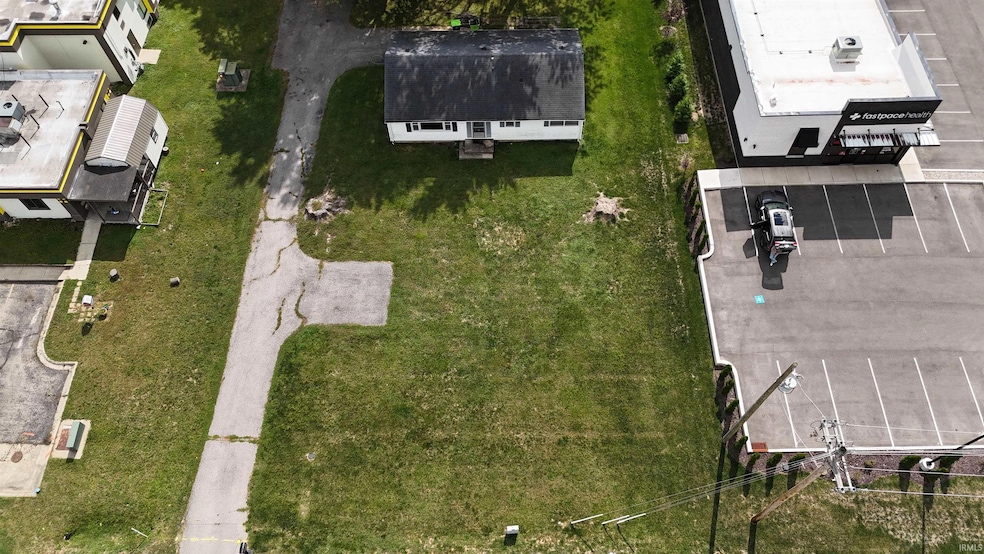
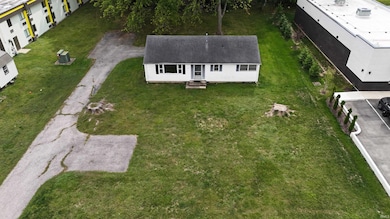
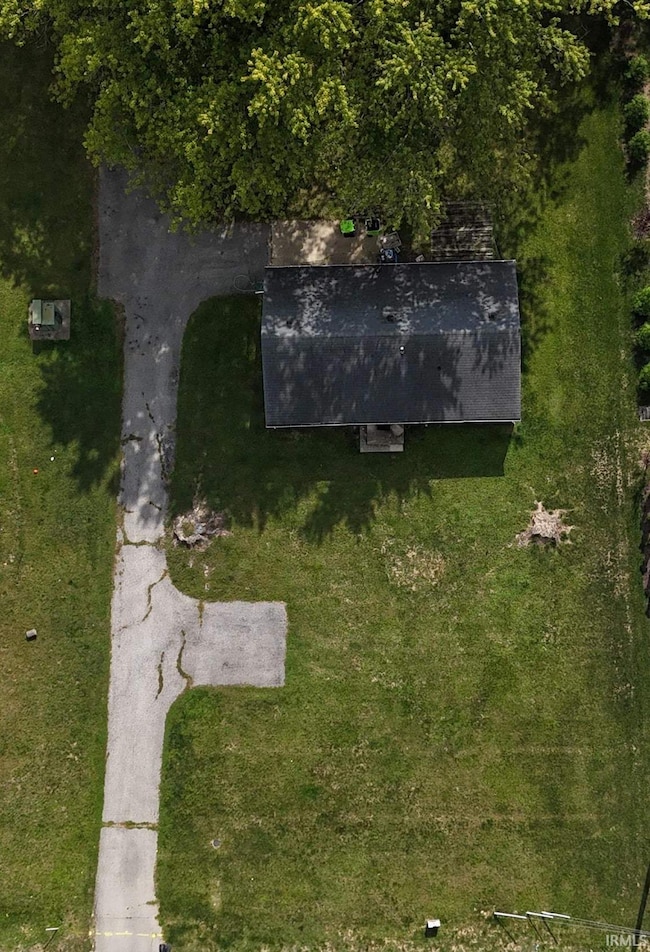
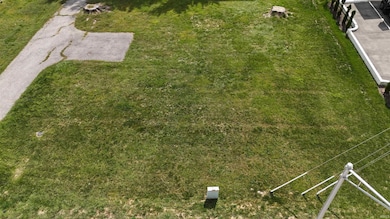
High Visibility Commercial Lot for Sale. This property sits on 0.46 acres and is located in on East Market Street in an upcoming area with several development businesses. Here is your chance to get one of the last available lots on East Market Street across from The Junction. This is a prime commercial lot waiting on a developer.
Listing Agent
Rogers Auction & Real Estate Brokerage Phone: 574-727-5606 Listed on: 09/26/2025
Property Details
Property Type
- Land
Est. Annual Taxes
- $2,208
Lot Details
- 0.46 Acre Lot
- Lot Dimensions are 100x200
- Finished Lot(s)
Parking
- Driveway
- Off-Street Parking
Schools
- Landis Elementary School
- Logansport Middle School
- Logansport High School
Utilities
- Heating System Uses Gas
Listing and Financial Details
- Assessor Parcel Number 09-17-28-320-007.000-010
Map
Home Values in the Area
Average Home Value in this Area
Tax History
| Year | Tax Paid | Tax Assessment Tax Assessment Total Assessment is a certain percentage of the fair market value that is determined by local assessors to be the total taxable value of land and additions on the property. | Land | Improvement |
|---|---|---|---|---|
| 2024 | $2,081 | $110,400 | $24,400 | $86,000 |
| 2023 | $2,081 | $103,800 | $24,400 | $79,400 |
| 2022 | $1,904 | $95,200 | $24,400 | $70,800 |
| 2021 | $1,622 | $81,100 | $21,100 | $60,000 |
| 2020 | $1,556 | $77,800 | $21,100 | $56,700 |
| 2019 | $1,556 | $77,800 | $21,100 | $56,700 |
| 2018 | $1,644 | $82,200 | $21,100 | $61,100 |
| 2017 | $1,620 | $81,000 | $21,100 | $59,900 |
| 2016 | $1,514 | $75,700 | $22,200 | $53,500 |
| 2014 | $1,324 | $66,200 | $22,200 | $44,000 |
| 2013 | $1,324 | $65,200 | $22,200 | $43,000 |
Property History
| Date | Event | Price | List to Sale | Price per Sq Ft |
|---|---|---|---|---|
| 09/26/2025 09/26/25 | For Sale | $451,111 | -- | -- |
Purchase History
| Date | Type | Sale Price | Title Company |
|---|---|---|---|
| Warranty Deed | -- | None Listed On Document | |
| Warranty Deed | -- | None Listed On Document |
Mortgage History
| Date | Status | Loan Amount | Loan Type |
|---|---|---|---|
| Open | $83,250 | New Conventional |
Source: Indiana Regional MLS
MLS Number: 202539138
APN: 09-17-28-320-007.000-010
Disclaimer: Certain information contained herein is derived from information provided by parties other than Homes.com. All information provided is deemed reliable, but is not guaranteed to be accurate and should be independently verified.
![]() IDX information is provided exclusively for personal, non-commercial use, and may not be used for any purpose other than to identify prospective properties consumers may be interested in purchasing. Information is deemed reliable but not guaranteed.
IDX information is provided exclusively for personal, non-commercial use, and may not be used for any purpose other than to identify prospective properties consumers may be interested in purchasing. Information is deemed reliable but not guaranteed.
- 802 Walnut Ridge E
- 14 Golfview Dr
- 4202 Lexington Rd
- 3128 N Pennsylvania Ave
- 204 Kingsmill Dr
- 320 W Roselawn Dr
- 308 Longtree Ln
- 207 Longtree Ln
- 3044 N Pennsylvania Ave
- 4618 N Shady Ln
- 408 E Shady Ln
- 217 W Roselawn Dr
- 3055 North St
- 2700 High St
- 2419 Stadium Dr
- 925 Timbercrest Dr
- 0 Cornwall Rd Unit 202542880
- 0 Cornwall Rd Unit 202427625
- 1004 Timbercrest Dr
- 2116 Usher St
- 900 North St
- 1423 Johnson St
- 1873 Warhawk Rd
- 2002 Shaw Ave
- 1010 N Lincoln St
- 548 Sycamore Trail
- 1852 S Business 31
- 2920 S Hilltop Dr
- 59 W Riverside Dr Unit Upper
- 700 Bobtail Ct
- 127 W Jackson Unit 22 St Unit 22
- 127 W Jackson Unit 23 St Unit 23
- 127 W Jackson Unit 11 St Unit 11
- 127 W Jackson Unit 13 St Unit 13
- 127 W Jackson St
- 2083 W 425 N
- 2900 N Apperson Way Unit 55
- 2900 N Apperson Way Unit 17
- 2501 N Apperson Way Unit 5
- 2713 N Delphos St
