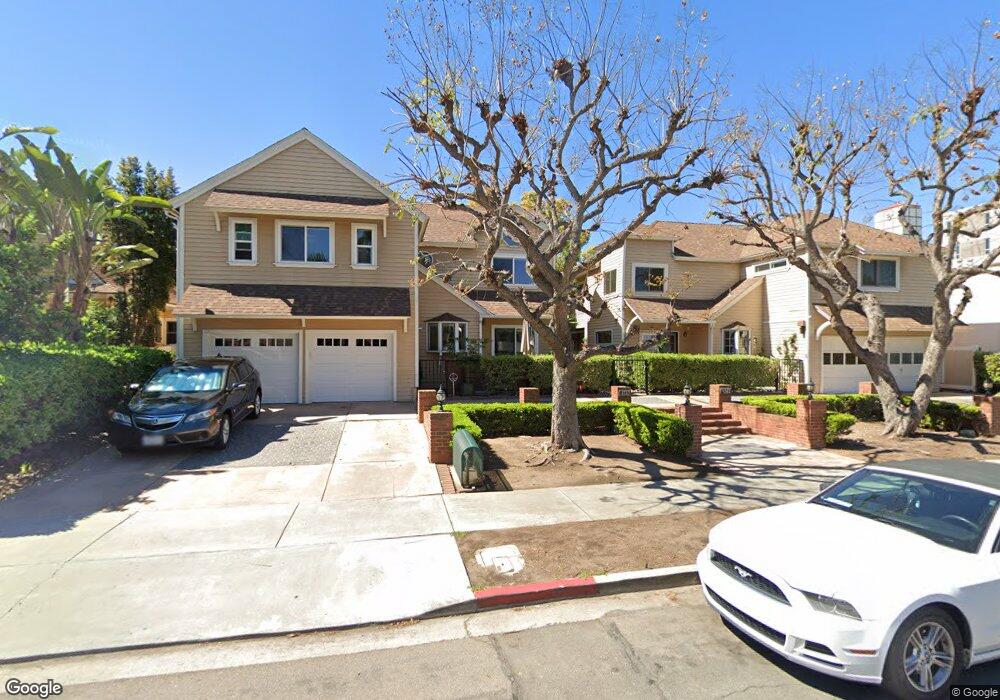
3732 7th Ave Unit B San Diego, CA 92103
Hillcrest NeighborhoodEstimated Value: $797,663 - $954,000
2
Beds
3
Baths
1,250
Sq Ft
$685/Sq Ft
Est. Value
About This Home
This home is located at 3732 7th Ave Unit B, San Diego, CA 92103 and is currently estimated at $856,666, approximately $685 per square foot. 3732 7th Ave Unit B is a home located in San Diego County with nearby schools including Florence Elementary School, Roosevelt International Middle School, and Museum School.
Ownership History
Date
Name
Owned For
Owner Type
Purchase Details
Closed on
Jul 19, 2012
Sold by
Taubman Anna C
Bought by
Sekhri Alwyn
Current Estimated Value
Home Financials for this Owner
Home Financials are based on the most recent Mortgage that was taken out on this home.
Original Mortgage
$369,000
Outstanding Balance
$253,021
Interest Rate
3.53%
Mortgage Type
Purchase Money Mortgage
Estimated Equity
$603,645
Purchase Details
Closed on
Apr 3, 2008
Sold by
Taubman Anne C
Bought by
Bella Daniel Trust and Taubman Anne C
Purchase Details
Closed on
May 26, 1998
Sold by
Taubman Anne C Trust 06-28-90 and Anne C
Bought by
Taubman Anne C
Home Financials for this Owner
Home Financials are based on the most recent Mortgage that was taken out on this home.
Original Mortgage
$143,000
Interest Rate
7%
Purchase Details
Closed on
Aug 17, 1990
Purchase Details
Closed on
Oct 28, 1983
Create a Home Valuation Report for This Property
The Home Valuation Report is an in-depth analysis detailing your home's value as well as a comparison with similar homes in the area
Home Values in the Area
Average Home Value in this Area
Purchase History
| Date | Buyer | Sale Price | Title Company |
|---|---|---|---|
| Sekhri Alwyn | $410,000 | Lawyers Title | |
| Bella Daniel Trust | -- | None Available | |
| Taubman Anne C | -- | Old Republic Title Company | |
| -- | $195,000 | -- | |
| -- | $132,000 | -- |
Source: Public Records
Mortgage History
| Date | Status | Borrower | Loan Amount |
|---|---|---|---|
| Open | Sekhri Alwyn | $369,000 | |
| Previous Owner | Taubman Anne C | $143,000 |
Source: Public Records
Tax History Compared to Growth
Tax History
| Year | Tax Paid | Tax Assessment Tax Assessment Total Assessment is a certain percentage of the fair market value that is determined by local assessors to be the total taxable value of land and additions on the property. | Land | Improvement |
|---|---|---|---|---|
| 2025 | $6,025 | $504,871 | $258,913 | $245,958 |
| 2024 | $6,025 | $494,973 | $253,837 | $241,136 |
| 2023 | $5,890 | $485,268 | $248,860 | $236,408 |
| 2022 | $5,732 | $475,754 | $243,981 | $231,773 |
| 2021 | $5,691 | $466,427 | $239,198 | $227,229 |
| 2020 | $5,622 | $461,646 | $236,746 | $224,900 |
| 2019 | $5,520 | $452,595 | $232,104 | $220,491 |
| 2018 | $5,160 | $443,721 | $227,553 | $216,168 |
| 2017 | $5,036 | $435,022 | $223,092 | $211,930 |
| 2016 | $4,954 | $426,493 | $218,718 | $207,775 |
| 2015 | $4,880 | $420,088 | $215,433 | $204,655 |
| 2014 | $4,802 | $411,860 | $211,213 | $200,647 |
Source: Public Records
Map
Nearby Homes
- 3774 5th Ave Unit 7-10
- 3740 5th Ave
- 3663 7th Ave Unit 1
- 3650 5th Ave Unit 404
- 3650 5th Ave Unit 415
- 3687 4th Ave Unit 315
- 3635 7th Ave Unit 6C
- 3635 7th Ave Unit 13E
- 3635 7th Ave Unit 2D
- 3635 7th Ave Unit 15G
- 3635 7th Ave Unit 9E
- 3634 7th Ave Unit 4B
- 3925 7th Ave
- 3942 8th Ave
- 3666 3rd Ave Unit 202
- 3967-69 8th Ave
- 3973 8th Ave
- 3975-77 8th Ave
- 1032 Pennsylvania Ave
- 3565 3rd Ave
- 3732 7th Ave Unit D
- 3732 7th Ave Unit C
- 3732 7th Ave Unit A
- 3742 7th Ave Unit C
- 3742 7th Ave Unit D
- 3742 7th Ave Unit B
- 3742 7th Ave Unit A
- 3710 7th Ave Unit 20
- 3744 7th Ave
- 3725 6th Ave
- 3739 6th Ave
- 3775 Sixth Ave
- 3775 6th Ave
- 3715-3795 6th Ave
- 635 Robinson Ave Unit FL6-ID56
- 635 Robinson Ave Unit ID1254834P
- 635 Robinson Ave Unit ID1254835P
- 635 Robinson Ave Unit FL4-ID9
- 635 Robinson Ave Unit 703
- 635 Robinson Ave Unit 516