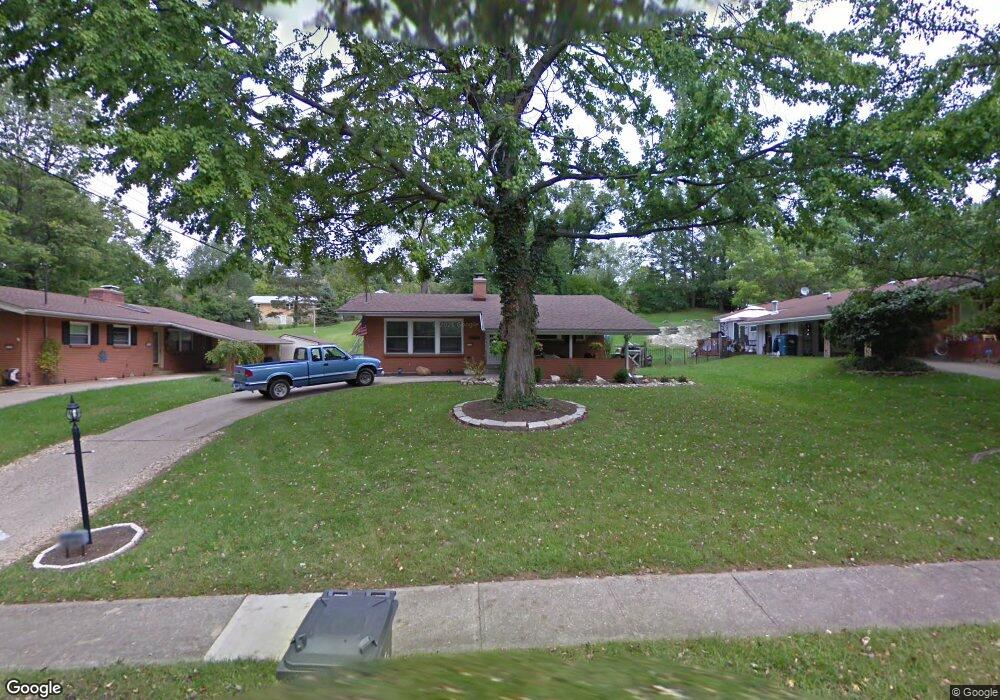
3732 Belfast Ave Cincinnati, OH 45236
Estimated Value: $244,445 - $275,000
3
Beds
2
Baths
936
Sq Ft
$282/Sq Ft
Est. Value
About This Home
This home is located at 3732 Belfast Ave, Cincinnati, OH 45236 and is currently estimated at $264,361, approximately $282 per square foot. 3732 Belfast Ave is a home located in Hamilton County with nearby schools including Amity Elementary School, Deer Park Jr/Sr High School, and Ohr Torah Cincinnati.
Ownership History
Date
Name
Owned For
Owner Type
Purchase Details
Closed on
Jun 4, 2008
Sold by
Ward Dana D and Merida Dana D
Bought by
Merida Dana D and Merida Jeffery A
Current Estimated Value
Purchase Details
Closed on
May 15, 2006
Sold by
Lammers Aaron D and Lammers Kangsan
Bought by
Ward Dana D
Home Financials for this Owner
Home Financials are based on the most recent Mortgage that was taken out on this home.
Original Mortgage
$112,000
Outstanding Balance
$68,396
Interest Rate
7.37%
Mortgage Type
Fannie Mae Freddie Mac
Estimated Equity
$195,965
Purchase Details
Closed on
May 16, 2000
Sold by
Piatt Kenneth O and Piatt Irma V
Bought by
Lammers Aaron D
Home Financials for this Owner
Home Financials are based on the most recent Mortgage that was taken out on this home.
Original Mortgage
$100,185
Interest Rate
8.21%
Mortgage Type
VA
Create a Home Valuation Report for This Property
The Home Valuation Report is an in-depth analysis detailing your home's value as well as a comparison with similar homes in the area
Home Values in the Area
Average Home Value in this Area
Purchase History
| Date | Buyer | Sale Price | Title Company |
|---|---|---|---|
| Merida Dana D | -- | Landstar Title Llc | |
| Ward Dana D | -- | None Available | |
| Lammers Aaron D | $103,900 | L & D Title Agency Inc |
Source: Public Records
Mortgage History
| Date | Status | Borrower | Loan Amount |
|---|---|---|---|
| Open | Ward Dana D | $112,000 | |
| Previous Owner | Lammers Aaron D | $100,185 |
Source: Public Records
Tax History Compared to Growth
Tax History
| Year | Tax Paid | Tax Assessment Tax Assessment Total Assessment is a certain percentage of the fair market value that is determined by local assessors to be the total taxable value of land and additions on the property. | Land | Improvement |
|---|---|---|---|---|
| 2024 | $3,390 | $62,969 | $13,601 | $49,368 |
| 2023 | $3,455 | $62,969 | $13,601 | $49,368 |
| 2022 | $3,359 | $47,156 | $11,893 | $35,263 |
| 2021 | $3,286 | $47,156 | $11,893 | $35,263 |
| 2020 | $2,996 | $47,156 | $11,893 | $35,263 |
| 2019 | $2,916 | $41,367 | $10,434 | $30,933 |
| 2018 | $2,917 | $41,367 | $10,434 | $30,933 |
| 2017 | $2,760 | $41,367 | $10,434 | $30,933 |
| 2016 | $2,651 | $39,201 | $10,749 | $28,452 |
| 2015 | $2,459 | $39,201 | $10,749 | $28,452 |
| 2014 | $2,461 | $39,201 | $10,749 | $28,452 |
| 2013 | $2,540 | $40,002 | $10,969 | $29,033 |
Source: Public Records
Map
Nearby Homes
- 3733 Lyndon Center Ct
- 8757 Wicklow Ave
- 8907 Eldora Dr
- 3925 Limerick Ave
- 3770 Donegal Dr
- 4034 Mantell Ave
- 3843 Blackwood Ct
- 8494 Wexford Ave
- 8521 Darnell Ave
- 2626 Hunt Rd
- 4053 Belfast Ave
- 8397 Wicklow Ave
- 2598 Maple Tree Ct
- 4068 Glenbar Ct
- 113 Waxwing Dr
- 8363 Wexford Ave
- 2590 Hunt Rd
- 4104 Estermarie Dr
- 1194 Fuhrman Rd
- 2451 Hunt Rd
- 3740 Belfast Ave
- 3726 Belfast Ave
- 3746 Belfast Ave
- 3720 Belfast Ave
- 3752 Belfast Ave
- 3681 Glengary Ln
- 3673 Glengary Ln
- 3695 Glengary Ln
- 3733 Belfast Ave
- 8699 Glenburney Ct
- 3712 Belfast Ave
- 3661 Glengary Ln
- 3727 Belfast Ave
- 3705 Glengary Ln
- 3760 Belfast Ave
- 3653 Glengary Ln
- 3721 Belfast Ave
- 3706 Belfast Ave
- 3715 Glengary Ln
- 3653 Glengary Ave