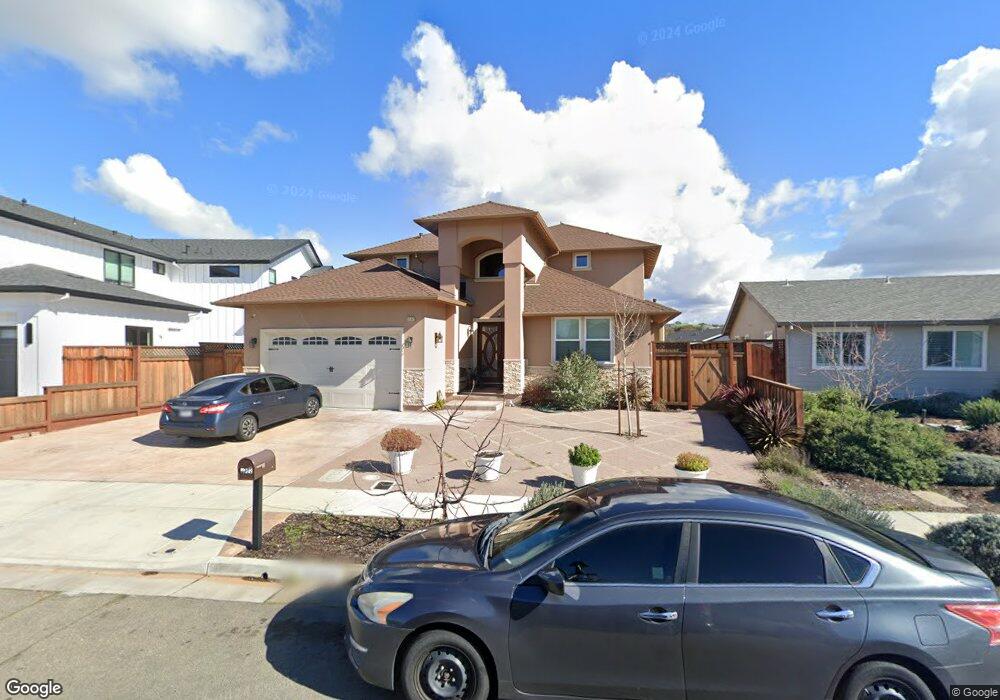
3732 Crestview Dr Santa Rosa, CA 95403
Northwest Santa Rosa NeighborhoodEstimated Value: $867,000 - $1,209,000
5
Beds
5
Baths
2,619
Sq Ft
$376/Sq Ft
Est. Value
About This Home
This home is located at 3732 Crestview Dr, Santa Rosa, CA 95403 and is currently estimated at $985,697, approximately $376 per square foot. 3732 Crestview Dr is a home located in Sonoma County with nearby schools including Hilliard Comstock Middle School, Piner High School, and Morrice Schaefer Charter School.
Ownership History
Date
Name
Owned For
Owner Type
Purchase Details
Closed on
Aug 21, 2001
Sold by
Martinez Ruben and Gutierrez Maria Guadalupe
Bought by
Martinez Ruben and Gutierrez Maria Guadalupe
Current Estimated Value
Home Financials for this Owner
Home Financials are based on the most recent Mortgage that was taken out on this home.
Original Mortgage
$198,000
Outstanding Balance
$77,571
Interest Rate
7.21%
Estimated Equity
$908,126
Purchase Details
Closed on
Oct 22, 1998
Sold by
Rivera Julio C and Carlo Dori
Bought by
Martinez Ruben and Gutierrez Maria Guadalupe
Home Financials for this Owner
Home Financials are based on the most recent Mortgage that was taken out on this home.
Original Mortgage
$189,150
Interest Rate
6.71%
Purchase Details
Closed on
Oct 12, 1993
Sold by
Callow Mildred S
Bought by
Rivera Julio C and Rivera Dori Del Carlo
Home Financials for this Owner
Home Financials are based on the most recent Mortgage that was taken out on this home.
Original Mortgage
$166,770
Interest Rate
6.81%
Mortgage Type
Assumption
Create a Home Valuation Report for This Property
The Home Valuation Report is an in-depth analysis detailing your home's value as well as a comparison with similar homes in the area
Home Values in the Area
Average Home Value in this Area
Purchase History
| Date | Buyer | Sale Price | Title Company |
|---|---|---|---|
| Martinez Ruben | $2,000 | New Century Title Company | |
| Martinez Ruben | $195,000 | Fidelity National Title Co | |
| Rivera Julio C | $168,500 | North Bay Title Co |
Source: Public Records
Mortgage History
| Date | Status | Borrower | Loan Amount |
|---|---|---|---|
| Open | Martinez Ruben | $198,000 | |
| Closed | Martinez Ruben | $189,150 | |
| Previous Owner | Rivera Julio C | $166,770 |
Source: Public Records
Tax History Compared to Growth
Tax History
| Year | Tax Paid | Tax Assessment Tax Assessment Total Assessment is a certain percentage of the fair market value that is determined by local assessors to be the total taxable value of land and additions on the property. | Land | Improvement |
|---|---|---|---|---|
| 2025 | $5,227 | $479,095 | $117,569 | $361,526 |
| 2024 | $5,227 | $469,702 | $115,264 | $354,438 |
| 2023 | $5,227 | $230,318 | $113,004 | $117,314 |
| 2022 | $2,434 | $225,803 | $110,789 | $115,014 |
| 2021 | $2,543 | $221,376 | $108,617 | $112,759 |
| 2020 | $2,556 | $219,107 | $107,504 | $111,603 |
| 2019 | $1,208 | $105,397 | $105,397 | $0 |
| 2018 | $1,193 | $103,331 | $103,331 | $0 |
| 2017 | $3,108 | $263,398 | $101,305 | $162,093 |
| 2016 | $3,071 | $258,234 | $99,319 | $158,915 |
| 2015 | $2,962 | $254,356 | $97,828 | $156,528 |
| 2014 | $2,851 | $249,374 | $95,912 | $153,462 |
Source: Public Records
Map
Nearby Homes
- 3745 Crestview Dr
- 3701 Crestview Dr
- 3702 Hillary Ct
- 3748 Mocha Ln
- 3593 Banyan St
- 3751 Hennessy Place
- 2016 Dennis Ln
- 3523 Coffey Meadow Place
- 2017 Shelbourne Way
- 1795 Walnut Creek Dr
- 3829 Elwin Ln
- 3511 Barnes Rd
- 2132 Dennis Ln
- 2213 Tapian Way
- 2170 Bock St
- 2234 Gold Leaf Ln
- 4076 Old Redwood Hwy
- 3127 Clare Ave
- 2137 Avilar Place
- 816 Mary St
- 3724 Crestview Dr
- 1320 Crestview Ct
- 1316 Crestview Ct
- 3729 Crestview Dr
- 1331 Ridgecrest Ct
- 3735 Crestview Dr
- 3723 Crestview Dr
- 1327 Crestview Ct
- 3802 Crestview Dr
- 1312 Crestview Ct
- 3706 Crestview Dr
- 1349 Starview Dr Unit 1
- 3715 Crestview Dr
- 1325 Crestview Ct
- 1321 Crestview Ct
- 3810 Crestview Dr
- 1339 Ridgecrest Ct
- 1327 Ridgecrest Ct
- 1308 Crestview Ct
- 1317 Crestview Ct