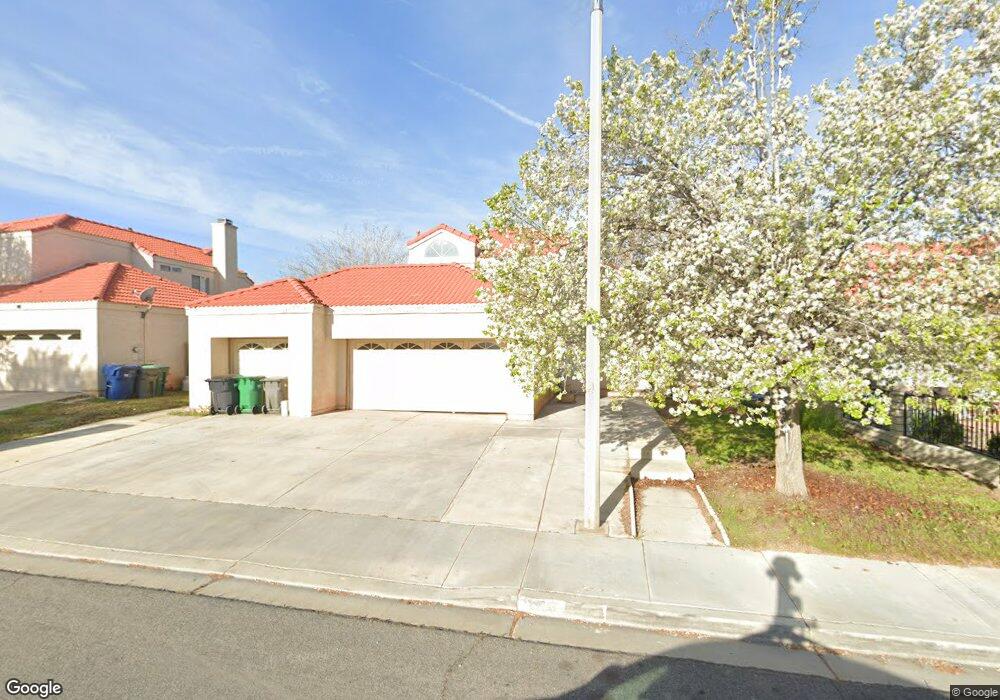
37321 Scranton Ct Palmdale, CA 93552
East Palmdale NeighborhoodEstimated Value: $476,000 - $509,000
4
Beds
3
Baths
2,059
Sq Ft
$241/Sq Ft
Est. Value
About This Home
This home is located at 37321 Scranton Ct, Palmdale, CA 93552 and is currently estimated at $495,966, approximately $240 per square foot. 37321 Scranton Ct is a home located in Los Angeles County with nearby schools including Mesquite Elementary School, Cactus Magnet Academy, and Knight High School.
Ownership History
Date
Name
Owned For
Owner Type
Purchase Details
Closed on
Sep 5, 2008
Sold by
Hsbc Bank Usa
Bought by
Gittens Wesley Louis
Current Estimated Value
Home Financials for this Owner
Home Financials are based on the most recent Mortgage that was taken out on this home.
Original Mortgage
$137,750
Outstanding Balance
$91,227
Interest Rate
6.43%
Mortgage Type
Purchase Money Mortgage
Estimated Equity
$404,739
Purchase Details
Closed on
May 12, 2008
Sold by
Allen Kevin M and Allen Wyvonne B
Bought by
Hsbc Bank Usa
Purchase Details
Closed on
May 5, 2004
Sold by
Merich Thorsten S and Merich Christina M
Bought by
Allen Kevin M
Home Financials for this Owner
Home Financials are based on the most recent Mortgage that was taken out on this home.
Original Mortgage
$180,200
Interest Rate
8.25%
Mortgage Type
Purchase Money Mortgage
Create a Home Valuation Report for This Property
The Home Valuation Report is an in-depth analysis detailing your home's value as well as a comparison with similar homes in the area
Home Values in the Area
Average Home Value in this Area
Purchase History
We collect this data history from publicly available records. To have your information removed, we recommend requesting removal directly through your county’s website.
| Date | Buyer | Sale Price | Title Company |
|---|---|---|---|
| Gittens Wesley Louis | $145,000 | Chicago Title Company | |
| Hsbc Bank Usa | $201,450 | None Available | |
| Allen Kevin M | $212,000 | Fidelity National Title Co |
Source: Public Records
Mortgage History
We collect this data history from publicly available records. To have your information removed, we recommend requesting removal directly through your county’s website.
| Date | Status | Borrower | Loan Amount |
|---|---|---|---|
| Open | Gittens Wesley Louis | $137,750 | |
| Previous Owner | Allen Kevin M | $180,200 | |
| Closed | Allen Kevin M | $31,800 |
Source: Public Records
Tax History
| Year | Tax Paid | Tax Assessment Tax Assessment Total Assessment is a certain percentage of the fair market value that is determined by local assessors to be the total taxable value of land and additions on the property. | Land | Improvement |
|---|---|---|---|---|
| 2025 | $3,740 | $186,706 | $37,334 | $149,372 |
| 2024 | $3,463 | $183,046 | $36,602 | $146,444 |
| 2023 | $3,434 | $179,458 | $35,885 | $143,573 |
| 2022 | $3,310 | $175,940 | $35,182 | $140,758 |
| 2021 | $3,227 | $172,492 | $34,493 | $137,999 |
| 2019 | $3,136 | $167,377 | $33,471 | $133,906 |
| 2018 | $3,090 | $164,096 | $32,815 | $131,281 |
| 2016 | $2,885 | $157,726 | $31,542 | $126,184 |
| 2015 | $2,860 | $155,358 | $31,069 | $124,289 |
| 2014 | $2,832 | $152,316 | $30,461 | $121,855 |
Source: Public Records
Map
Nearby Homes
- 4112 Lexington Ct
- 37940 123 42nd E
- 4103 Amalfi Dr
- 37401 Richmond St
- 4228 Trenton Ave
- 37513 Penara St
- 37111 Springfield St
- 37422 Morning Cir
- 0 45th St E
- 37064 Springfield St
- 37323 Daybreak St
- 37230 45th St E
- 37526 Daybreak St
- 37311 47th St E Unit 161
- 37311 47th St E Unit 187
- 37311 47th St E Unit 129
- 37311 47th St E Unit 40
- 37311 47th St E Unit 183
- 3811 Triton Dr
- 4537 Elwood Ave
- 37329 Scranton Ct
- 37333 Scranton Ct
- 37322 Springfield St
- 37330 Springfield St
- 37315 Scranton Ct
- 37316 Springfield St
- 37330 Scranton Ct
- 37324 Scranton Ct
- 37336 Scranton Ct
- 37308 Springfield St
- 37309 Scranton Ct
- 37318 Scranton Ct
- 4113 E Avenue r13
- 4109 E Avenue r13
- 37270 Springfield St
- 37310 Scranton Ct
- 4107 E Avenue r13
- 4107 E Avenue R 13
- 4056 E Palmdale Ave Unit R-13
- 4056 E Avenue r13
Your Personal Tour Guide
Ask me questions while you tour the home.