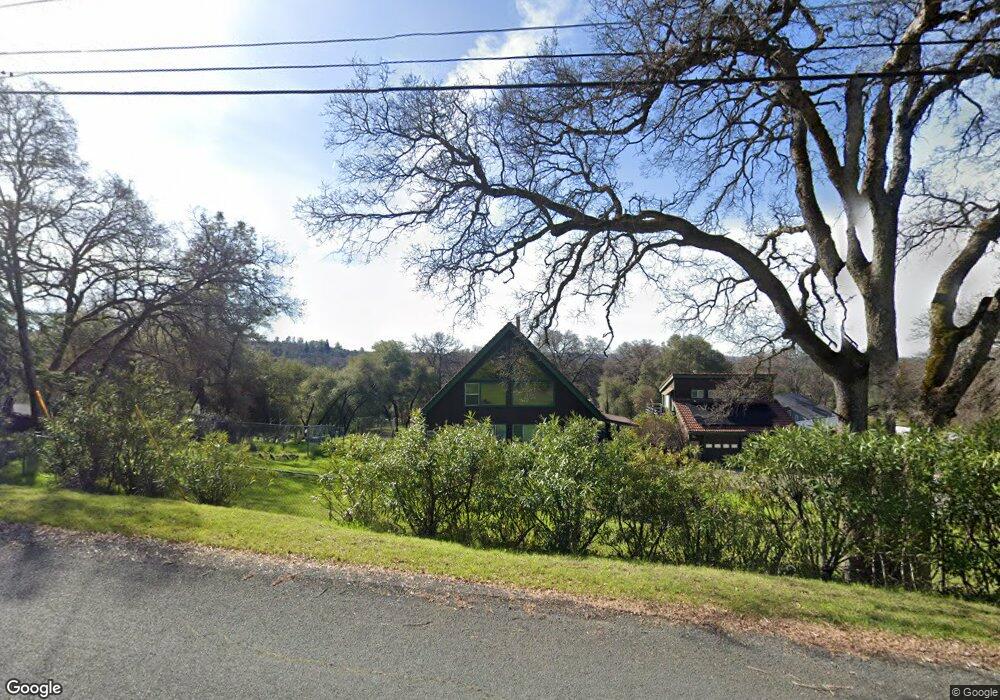
3733 Otto Way Auburn, CA 95602
Estimated Value: $409,000 - $748,000
3
Beds
2
Baths
2,000
Sq Ft
$309/Sq Ft
Est. Value
About This Home
This home is located at 3733 Otto Way, Auburn, CA 95602 and is currently estimated at $618,378, approximately $309 per square foot. 3733 Otto Way is a home located in Placer County with nearby schools including Sierra Hills Elementary School, Weimar Hills, and Colfax High School.
Ownership History
Date
Name
Owned For
Owner Type
Purchase Details
Closed on
Jun 7, 2024
Sold by
Daroza John
Bought by
Daroza Thuy
Current Estimated Value
Home Financials for this Owner
Home Financials are based on the most recent Mortgage that was taken out on this home.
Original Mortgage
$408,500
Outstanding Balance
$403,483
Interest Rate
7.22%
Mortgage Type
New Conventional
Estimated Equity
$214,895
Purchase Details
Closed on
Nov 24, 2015
Sold by
Daroza John and Daroza Thuy
Bought by
Daroza John and Daroza Thuy
Purchase Details
Closed on
Jun 14, 2011
Sold by
Rieser Ulrich and Rieser Marlis
Bought by
Da Roza John and Da Roza Thuy
Home Financials for this Owner
Home Financials are based on the most recent Mortgage that was taken out on this home.
Original Mortgage
$148,000
Interest Rate
4.55%
Mortgage Type
New Conventional
Purchase Details
Closed on
Apr 21, 1997
Sold by
Mrkvicka Dennis A and Mrkvicka Cheryl L
Bought by
Rieser Ulrich and Rieser Marlis
Create a Home Valuation Report for This Property
The Home Valuation Report is an in-depth analysis detailing your home's value as well as a comparison with similar homes in the area
Home Values in the Area
Average Home Value in this Area
Purchase History
| Date | Buyer | Sale Price | Title Company |
|---|---|---|---|
| Daroza Thuy | -- | Old Republic Title | |
| Daroza John | -- | Old Republic Title | |
| Daroza John | -- | None Available | |
| Da Roza John | $370,000 | Old Republic Title Company | |
| Rieser Ulrich | $200,000 | Old Republic Title Company |
Source: Public Records
Mortgage History
| Date | Status | Borrower | Loan Amount |
|---|---|---|---|
| Open | Daroza John | $408,500 | |
| Previous Owner | Da Roza John | $148,000 |
Source: Public Records
Tax History Compared to Growth
Tax History
| Year | Tax Paid | Tax Assessment Tax Assessment Total Assessment is a certain percentage of the fair market value that is determined by local assessors to be the total taxable value of land and additions on the property. | Land | Improvement |
|---|---|---|---|---|
| 2025 | $4,774 | $474,021 | $166,547 | $307,474 |
| 2023 | $4,774 | $455,617 | $160,081 | $295,536 |
| 2022 | $4,618 | $446,685 | $156,943 | $289,742 |
| 2021 | $4,518 | $437,927 | $153,866 | $284,061 |
| 2020 | $4,465 | $433,438 | $152,289 | $281,149 |
| 2019 | $4,377 | $424,940 | $149,303 | $275,637 |
| 2018 | $4,222 | $416,609 | $146,376 | $270,233 |
| 2017 | $4,145 | $408,441 | $143,506 | $264,935 |
| 2016 | $4,057 | $400,434 | $140,693 | $259,741 |
| 2015 | $3,958 | $394,420 | $138,580 | $255,840 |
| 2014 | $3,897 | $386,695 | $135,866 | $250,829 |
Source: Public Records
Map
Nearby Homes
- 5200 Thomas Dr
- 4765 Garden Ct
- 5900 Stanley Dr
- 3116 Sunshine Meadow Ln
- 4757 Gava Ct
- 14580 Mcelroy Rd
- 5011 Stanley Dr
- 3730 Kimo Way
- 0 Mcelroy Rd Unit 225065625
- 3120 Iron Mine Rd
- 13975 Moss Rock Dr
- 2790 Black Oak Rd
- 24316 Timber Ridge Dr
- 4 La Dolce Vita
- 2125 Dream Place
- 15288 William Dr
- 1711-Lot 323 The Point
- 1712-Lot 304 The Point
- 1662-Lot 299 The Point
- 1621 The Point