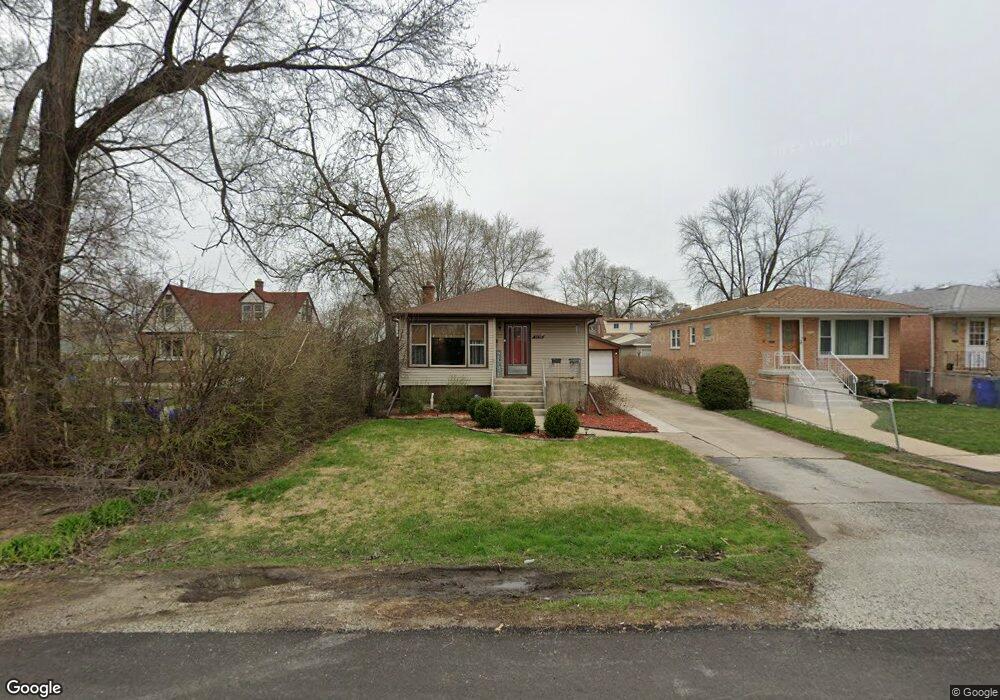
3734 W 117th St Chicago, IL 60803
Estimated Value: $278,000 - $690,000
3
Beds
1
Bath
1,138
Sq Ft
$454/Sq Ft
Est. Value
About This Home
This home is located at 3734 W 117th St, Chicago, IL 60803 and is currently estimated at $517,189, approximately $454 per square foot. 3734 W 117th St is a home located in Cook County with nearby schools including Lawn Manor School, Meadow Lane School, and Hamlin Upper Grade Center.
Ownership History
Date
Name
Owned For
Owner Type
Purchase Details
Closed on
Oct 6, 2015
Sold by
The Bank Of New York Mellon
Bought by
Beemsterboer William and Beemsterboer Lucy
Current Estimated Value
Purchase Details
Closed on
Jul 31, 2015
Sold by
Wasinski David A
Bought by
The Bank Of New York Mellon
Purchase Details
Closed on
Nov 25, 1996
Sold by
Wasinski David A and Wasinski Jennifer M
Bought by
Wasinski David A
Home Financials for this Owner
Home Financials are based on the most recent Mortgage that was taken out on this home.
Original Mortgage
$116,500
Interest Rate
7.6%
Purchase Details
Closed on
May 15, 1995
Sold by
Cecchini John A and Cecchini Mary Ann
Bought by
Wasinski David A and Wasinski Jennifer M
Home Financials for this Owner
Home Financials are based on the most recent Mortgage that was taken out on this home.
Original Mortgage
$111,759
Interest Rate
8.39%
Mortgage Type
FHA
Create a Home Valuation Report for This Property
The Home Valuation Report is an in-depth analysis detailing your home's value as well as a comparison with similar homes in the area
Home Values in the Area
Average Home Value in this Area
Purchase History
| Date | Buyer | Sale Price | Title Company |
|---|---|---|---|
| Beemsterboer William | $67,000 | Ct | |
| The Bank Of New York Mellon | -- | Attorney | |
| Wasinski David A | -- | -- | |
| Wasinski David A | $169,500 | -- |
Source: Public Records
Mortgage History
| Date | Status | Borrower | Loan Amount |
|---|---|---|---|
| Previous Owner | Wasinski David A | $116,500 | |
| Previous Owner | Wasinski David A | $111,759 |
Source: Public Records
Tax History Compared to Growth
Tax History
| Year | Tax Paid | Tax Assessment Tax Assessment Total Assessment is a certain percentage of the fair market value that is determined by local assessors to be the total taxable value of land and additions on the property. | Land | Improvement |
|---|---|---|---|---|
| 2024 | $5,734 | $17,617 | $3,334 | $14,283 |
| 2023 | $4,833 | $20,000 | $3,334 | $16,666 |
| 2022 | $4,833 | $13,894 | $2,858 | $11,036 |
| 2021 | $4,606 | $13,892 | $2,857 | $11,035 |
| 2020 | $4,604 | $13,892 | $2,857 | $11,035 |
| 2019 | $4,644 | $13,686 | $2,540 | $11,146 |
| 2018 | $4,469 | $13,686 | $2,540 | $11,146 |
| 2017 | $3,409 | $13,686 | $2,540 | $11,146 |
| 2016 | $3,400 | $12,077 | $2,063 | $10,014 |
| 2015 | $3,289 | $12,077 | $2,063 | $10,014 |
| 2014 | $3,248 | $12,077 | $2,063 | $10,014 |
| 2013 | $2,696 | $11,372 | $2,063 | $9,309 |
Source: Public Records
Map
Nearby Homes
- 3735 W 116th Place
- 3820 W 117th St
- 11700 S Springfield Ave
- 3836 W 115th Place
- 11809 S Millard Ave
- 3600 W 115th St
- 11551 S Komensky Ave
- 11404 S Millard Ave
- 3754 W 120th St Unit 2D
- 11720 S Komensky Ave
- 11800 S Komensky Ave Unit 203
- 11749 S Karlov Ave
- 11801 S Karlov Ave Unit 303
- 3412 W 115th St
- 11750 S Homan Ave Unit J
- 11305 S Central Park Ave
- 3609 W 121st St
- 11811 S Tripp Ave
- 11625 S Kildare Ave
- 4317 W Linecrest Dr
- 3734 W 117th St
- 3732 W 117th St
- 3730 W 117th St
- 3738 W 117th St
- 3728 W 117th St
- 3724 W 117th St
- 3740 W 117th St
- 3731 W 116th Place
- 3737 W 116th Place
- 3723 W 116th Place
- 3721 W 116th Place
- 11700 S Ridgeway Ave
- 3741 W 116th Place
- 3718 W 117th St
- 3719 W 116th Place
- 11657 S Hamlin Ave
- 3743 W 116th Place
- 3718 N Lincoln Ave
- 3717 W 116th Place
- 3755 W 116th Place