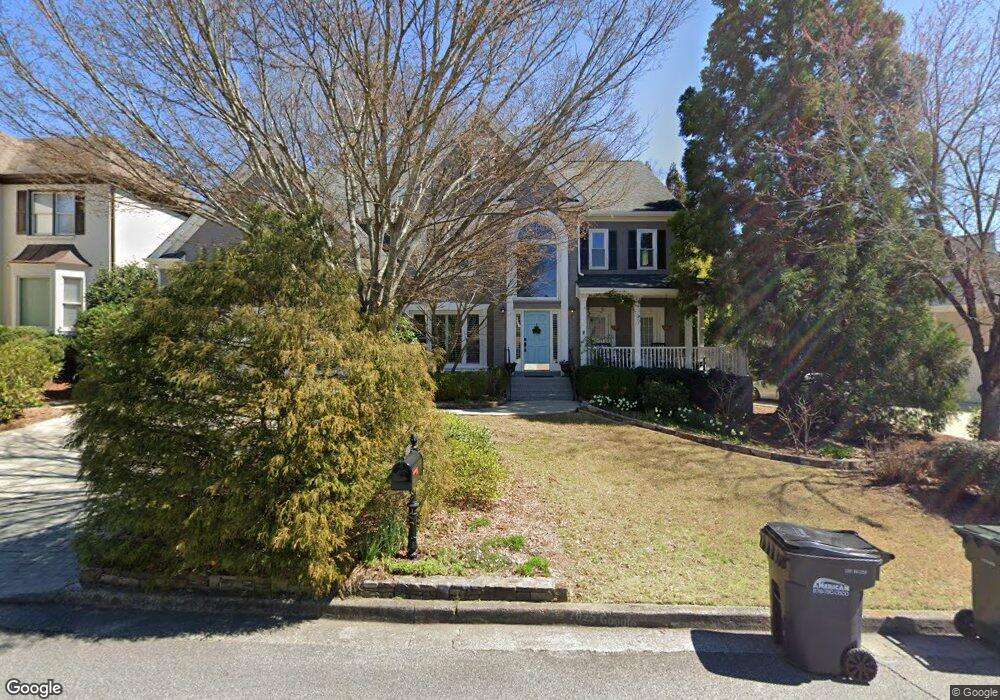
3735 Tynemoore Trace SE Smyrna, GA 30080
Estimated Value: $807,369 - $1,303,000
5
Beds
4
Baths
3,682
Sq Ft
$262/Sq Ft
Est. Value
About This Home
This home is located at 3735 Tynemoore Trace SE, Smyrna, GA 30080 and is currently estimated at $965,092, approximately $262 per square foot. 3735 Tynemoore Trace SE is a home located in Cobb County with nearby schools including Teasley Elementary School, Campbell Middle School, and Campbell High School.
Ownership History
Date
Name
Owned For
Owner Type
Purchase Details
Closed on
Oct 21, 2014
Sold by
Ackerman Dennis M
Bought by
Overstreet John O and Overstreet Paige E
Current Estimated Value
Home Financials for this Owner
Home Financials are based on the most recent Mortgage that was taken out on this home.
Original Mortgage
$399,600
Outstanding Balance
$307,271
Interest Rate
4.26%
Mortgage Type
New Conventional
Estimated Equity
$657,821
Purchase Details
Closed on
Aug 9, 2006
Sold by
Hudson Christopher I and Hudson Kimberly S
Bought by
Ackerman Dennis M and Ackerman Virginia O
Create a Home Valuation Report for This Property
The Home Valuation Report is an in-depth analysis detailing your home's value as well as a comparison with similar homes in the area
Home Values in the Area
Average Home Value in this Area
Purchase History
| Date | Buyer | Sale Price | Title Company |
|---|---|---|---|
| Overstreet John O | $499,500 | -- | |
| Ackerman Dennis M | $542,000 | -- |
Source: Public Records
Mortgage History
| Date | Status | Borrower | Loan Amount |
|---|---|---|---|
| Open | Overstreet John O | $399,600 |
Source: Public Records
Tax History Compared to Growth
Tax History
| Year | Tax Paid | Tax Assessment Tax Assessment Total Assessment is a certain percentage of the fair market value that is determined by local assessors to be the total taxable value of land and additions on the property. | Land | Improvement |
|---|---|---|---|---|
| 2025 | $8,210 | $320,248 | $80,000 | $240,248 |
| 2024 | $8,216 | $320,248 | $80,000 | $240,248 |
| 2023 | $7,056 | $291,776 | $56,000 | $235,776 |
| 2022 | $6,255 | $227,832 | $48,000 | $179,832 |
| 2021 | $6,255 | $227,832 | $48,000 | $179,832 |
| 2020 | $5,497 | $193,197 | $43,200 | $149,997 |
| 2019 | $5,967 | $214,664 | $48,000 | $166,664 |
| 2018 | $5,967 | $214,664 | $48,000 | $166,664 |
| 2017 | $5,294 | $196,412 | $48,000 | $148,412 |
| 2016 | $5,297 | $196,412 | $48,000 | $148,412 |
| 2015 | $5,425 | $196,412 | $48,000 | $148,412 |
| 2014 | $5,414 | $182,228 | $0 | $0 |
Source: Public Records
Map
Nearby Homes
- 1914 Tynemoore Ct SE
- 4097 Gilmore Rd SE
- 2133 Lucerne Ln SE
- 3703 Tynemoore Trace SE
- 4089 Thorndale Ln SE Unit 13
- 3974 Basque Cir SE
- 3927 Pineview Dr SE
- 4204 Norbury Ct SE
- 2027 Cooper Lake Dr SE
- 2295 Falmouth Ct SE Unit 23
- 2291 Falmouth Ct SE Unit 23
- 2150 Whitestone Ct SE
- 3916 Ridgewood Dr SE
- 2105 Monhegan Way SE Unit 13
- 3854 Ridgewood Dr SE
- 1982 Cheyanne Dr SE
- 2282 McLean Chase SE
- 4100 Paces Walk SE Unit 1306
- 4100 Paces Walk SE Unit 3205
- 4100 Paces Walk SE Unit 1303
- 3733 Tynemoore Trace SE
- 3739 Tynemoore Trace SE
- 3743 Tynemoore Trace SE
- 3731 Tynemoore Trace SE
- 3814 Tynemoore Walk SE
- 3816 Tynemoore Walk SE
- 3812 Tynemoore Walk SE
- 3734 Tynemoore Trace SE
- 3736 Tynemoore Trace SE
- 3818 Tynemoore Walk SE
- 3729 Tynemoore Trace SE
- 3738 Tynemoore Trace SE
- 3810 Tynemoore Walk SE
- 3728 Tynemoore Trace SE
- 0 Tynemoore Walk SE Unit 7248436
- 0 Tynemoore Walk SE Unit 7067406
- 0 Tynemoore Walk SE Unit 3183705
- 0 Tynemoore Walk SE Unit 8399525
- 0 Tynemoore Walk SE Unit 8355820
- 0 Tynemoore Walk SE Unit 8230031