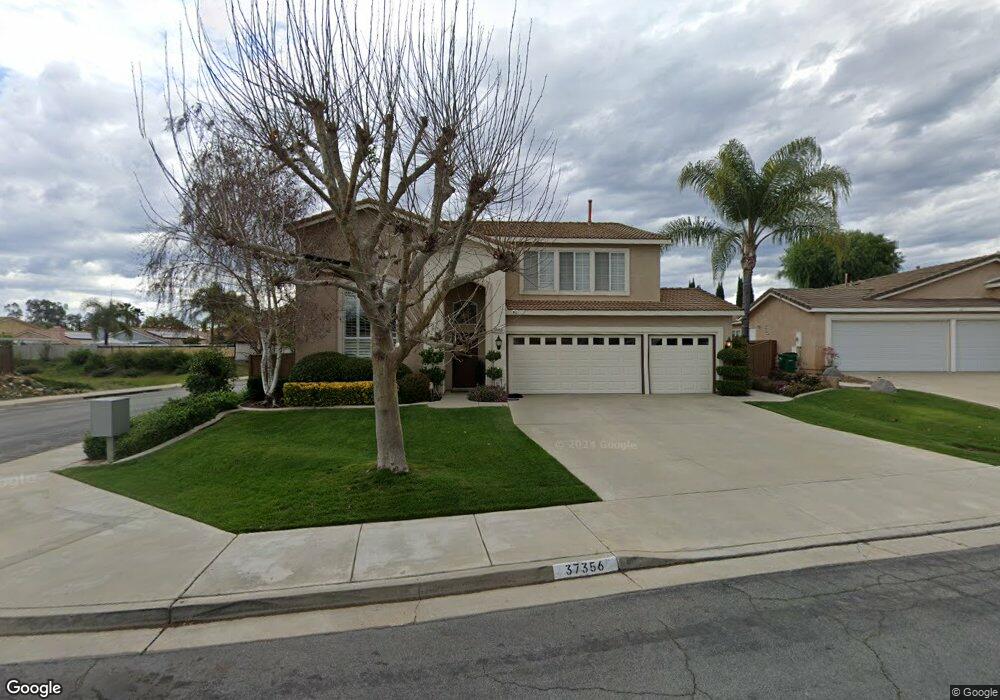
37356 Huckaby Ln Murrieta, CA 92562
Estimated Value: $662,000 - $798,000
4
Beds
3
Baths
2,622
Sq Ft
$282/Sq Ft
Est. Value
About This Home
This home is located at 37356 Huckaby Ln, Murrieta, CA 92562 and is currently estimated at $739,566, approximately $282 per square foot. 37356 Huckaby Ln is a home located in Riverside County with nearby schools including Cole Canyon Elementary School, Thompson Middle School, and Murrieta Valley High School.
Ownership History
Date
Name
Owned For
Owner Type
Purchase Details
Closed on
Jun 29, 2022
Sold by
Hoyt Tracy Glen and Hoyt Kristine Dawn
Bought by
Hoyt Tracy G & Kristine D Family Trust and Hoyt
Current Estimated Value
Purchase Details
Closed on
Feb 12, 1999
Sold by
Glen Hoyt Tracy and Glen Dawn Hoyt
Bought by
Hoyt Tracy Glen and Hoyt Kristine Dawn
Home Financials for this Owner
Home Financials are based on the most recent Mortgage that was taken out on this home.
Original Mortgage
$147,300
Interest Rate
6.78%
Mortgage Type
Purchase Money Mortgage
Purchase Details
Closed on
Dec 13, 1993
Sold by
Inco Homes Corp
Bought by
Hoyt Tracy Glen and Hoyt Kristine Dawn
Home Financials for this Owner
Home Financials are based on the most recent Mortgage that was taken out on this home.
Original Mortgage
$156,070
Interest Rate
7.09%
Mortgage Type
FHA
Create a Home Valuation Report for This Property
The Home Valuation Report is an in-depth analysis detailing your home's value as well as a comparison with similar homes in the area
Purchase History
| Date | Buyer | Sale Price | Title Company |
|---|---|---|---|
| Hoyt Tracy G & Kristine D Family Trust | -- | None Listed On Document | |
| Hoyt Tracy Glen | -- | First American Title Co | |
| Hoyt Tracy Glen | $162,000 | Chicago Title |
Source: Public Records
Mortgage History
| Date | Status | Borrower | Loan Amount |
|---|---|---|---|
| Previous Owner | Hoyt Tracy Glen | $147,300 | |
| Previous Owner | Hoyt Tracy Glen | $156,070 |
Source: Public Records
Tax History
| Year | Tax Paid | Tax Assessment Tax Assessment Total Assessment is a certain percentage of the fair market value that is determined by local assessors to be the total taxable value of land and additions on the property. | Land | Improvement |
|---|---|---|---|---|
| 2025 | $4,148 | $302,245 | $93,091 | $209,154 |
| 2023 | $4,148 | $290,510 | $89,477 | $201,033 |
| 2022 | $4,116 | $284,815 | $87,723 | $197,092 |
| 2021 | $4,044 | $279,231 | $86,003 | $193,228 |
| 2020 | $6,852 | $276,369 | $85,122 | $191,247 |
| 2019 | $6,782 | $270,951 | $83,453 | $187,498 |
| 2018 | $6,709 | $265,639 | $81,818 | $183,821 |
| 2017 | $6,638 | $260,431 | $80,214 | $180,217 |
| 2016 | $6,589 | $255,326 | $78,642 | $176,684 |
| 2015 | $6,561 | $251,492 | $77,461 | $174,031 |
| 2014 | $6,415 | $246,568 | $75,945 | $170,623 |
Source: Public Records
Map
Nearby Homes
- 37258 Huckaby Ln
- 37211 Jerome Ln
- 23250 Rancho Mirlo Rd
- 0 Rancho Mirlo Rd Unit IV25186834
- 37168 Santa Rosa Glen Dr
- 37528 Windsor Ct
- 23046 Joaquin Ridge Dr
- 42753 Oak View Place
- 23480 Bending Oak Ct
- 23450 Bristol Way
- 23571 Evening Primrose Ct
- 22952 Joaquin Ridge Dr
- 23263 Copa de Oro Ct
- 23239 Copa de Oro Ct
- 23483 Karen Place
- 23558 Evening Primrose Ct
- 23570 Evening Primrose Ct
- 23244 Copa de Oro Ct
- 23256 Copa de Oro Ct
- 23490 Karen Place
- 37364 Huckaby Ln
- 37378 Huckaby Ln
- 37369 Deep Wood Dr
- 37336 Huckaby Ln
- 37377 Deep Wood Dr
- 37373 Deep Wood Dr
- 37383 Deep Wood Dr
- 37384 Huckaby Ln
- 37355 Huckaby Ln
- 37367 Huckaby Ln
- 37310 Huckaby Ln
- 37349 Huckaby Ln
- 37375 Huckaby Ln
- 37365 Deep Wood Dr
- 37321 Huckaby Ln
- 37391 Deep Wood Dr
- 37381 Huckaby Ln
- 37298 Huckaby Ln
- 37305 Huckaby Ln
- 37351 Deep Wood Dr
Your Personal Tour Guide
Ask me questions while you tour the home.