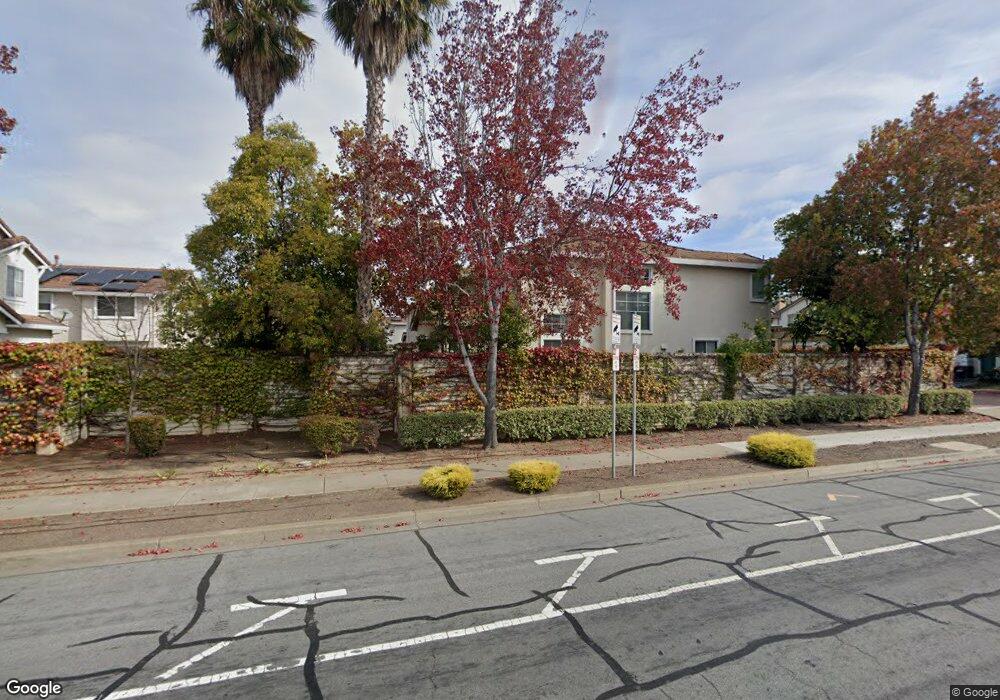
37359 Lantana Common Fremont, CA 94536
Centerville District NeighborhoodEstimated Value: $1,628,000 - $1,806,794
4
Beds
3
Baths
2,054
Sq Ft
$832/Sq Ft
Est. Value
About This Home
This home is located at 37359 Lantana Common, Fremont, CA 94536 and is currently estimated at $1,709,449, approximately $832 per square foot. 37359 Lantana Common is a home located in Alameda County with nearby schools including Glenmoor Elementary School, Centerville Junior High School, and Washington High School.
Ownership History
Date
Name
Owned For
Owner Type
Purchase Details
Closed on
Dec 22, 2010
Sold by
Millar Albert George and Thompson Janelle Marie
Bought by
Millar Albert George and Thompson Janelle Marie
Current Estimated Value
Home Financials for this Owner
Home Financials are based on the most recent Mortgage that was taken out on this home.
Original Mortgage
$305,000
Outstanding Balance
$192,620
Interest Rate
3.37%
Mortgage Type
New Conventional
Estimated Equity
$1,516,829
Purchase Details
Closed on
Nov 13, 2007
Sold by
Millar Albert George and Thompson Janelle Marie
Bought by
Millar Albert George and Thompson Janelle Marie
Purchase Details
Closed on
Jun 1, 1998
Sold by
Braddock & Logan Group Lp
Bought by
Millar Albert G and Thompson Janelle M
Home Financials for this Owner
Home Financials are based on the most recent Mortgage that was taken out on this home.
Original Mortgage
$324,600
Interest Rate
5.87%
Create a Home Valuation Report for This Property
The Home Valuation Report is an in-depth analysis detailing your home's value as well as a comparison with similar homes in the area
Home Values in the Area
Average Home Value in this Area
Purchase History
| Date | Buyer | Sale Price | Title Company |
|---|---|---|---|
| Millar Albert George | -- | Fidelity National Title | |
| Millar Albert George | -- | Fidelity National Title | |
| Millar Albert George | -- | None Available | |
| Millar Albert G | $406,000 | First American Title Guarant |
Source: Public Records
Mortgage History
| Date | Status | Borrower | Loan Amount |
|---|---|---|---|
| Open | Millar Albert George | $305,000 | |
| Previous Owner | Millar Albert G | $324,600 |
Source: Public Records
Tax History Compared to Growth
Tax History
| Year | Tax Paid | Tax Assessment Tax Assessment Total Assessment is a certain percentage of the fair market value that is determined by local assessors to be the total taxable value of land and additions on the property. | Land | Improvement |
|---|---|---|---|---|
| 2025 | $7,868 | $641,247 | $194,793 | $453,454 |
| 2024 | $7,868 | $628,540 | $190,975 | $444,565 |
| 2023 | $7,649 | $623,079 | $187,230 | $435,849 |
| 2022 | $7,541 | $603,862 | $183,559 | $427,303 |
| 2021 | $7,355 | $591,885 | $179,960 | $418,925 |
| 2020 | $7,351 | $592,747 | $178,116 | $414,631 |
| 2019 | $7,267 | $581,127 | $174,624 | $406,503 |
| 2018 | $7,122 | $569,735 | $171,201 | $398,534 |
| 2017 | $6,941 | $558,566 | $167,845 | $390,721 |
| 2016 | $6,817 | $547,616 | $164,554 | $383,062 |
| 2015 | $6,741 | $539,391 | $162,083 | $377,308 |
| 2014 | $6,621 | $528,826 | $158,908 | $369,918 |
Source: Public Records
Map
Nearby Homes
- 4737 Deadwood Dr
- 37721 Madera Ct
- 37114 Dondero Way
- 37792 Colfax Ct
- 4637 Rothbury Common
- 5268 Keeler Ct
- 37987 Alta Dr
- 5169 Lawler Ave
- 4586 Norris Rd
- 37659 Granville Dr
- 36720 Charles St
- 36686 Charles St
- 37001 Contra Costa Ave
- 4632 Balboa Way
- 38324 Blacow Rd
- 5113 Dupont Ave
- 36521 Cabrillo Dr
- 4715 Eggers Dr
- 5669 Civic Terrace Ave
- 36347 Magellan Dr
- 4926 Blueflower Terrace
- 37351 Lantana Common
- 4981 Roselle Common
- 4988 Roselle Common
- 4927 Blueflower Terrace
- 4984 Roselle Common
- 37358 Lantana Common
- 4992 Roselle Common
- 37343 Lantana Common
- 4980 Roselle Common
- 4977 Roselle Common
- 37350 Lantana Common
- 4976 Roselle Common
- 37335 Lantana Common
- 4918 Flowerwood Terrace
- 37342 Lantana Common
- 37359 Chinaberry Common
- 4973 Roselle Common
- 37349 Chinaberry Common
- 4972 Roselle Common