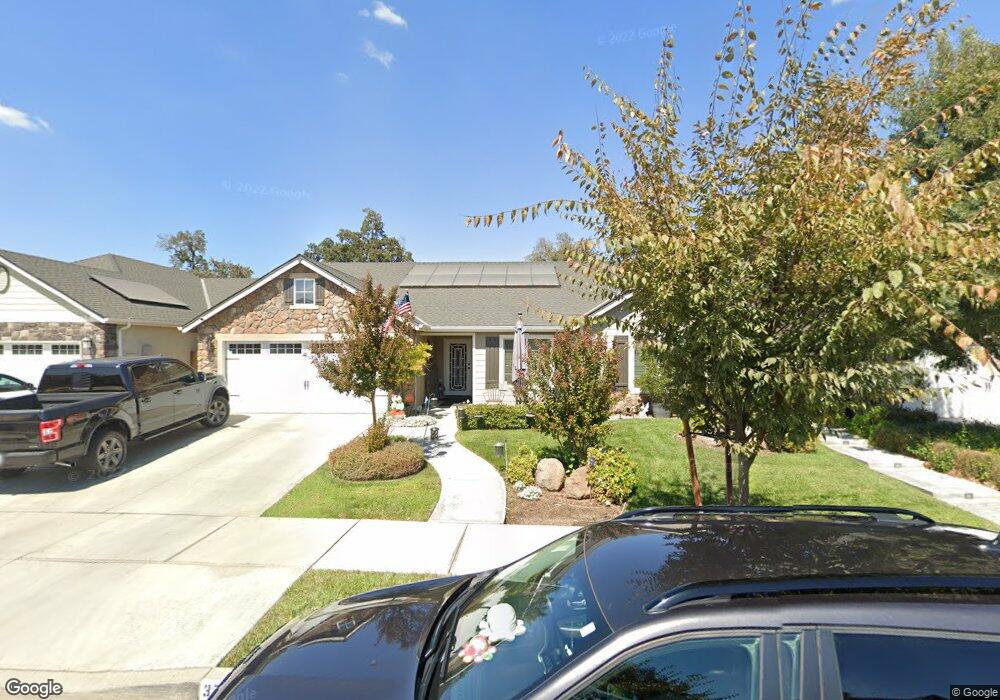
3736 W Ceres Ave Visalia, CA 93291
Northwest Visalia NeighborhoodEstimated Value: $474,521 - $523,000
4
Beds
2
Baths
2,001
Sq Ft
$250/Sq Ft
Est. Value
About This Home
This home is located at 3736 W Ceres Ave, Visalia, CA 93291 and is currently estimated at $499,630, approximately $249 per square foot. 3736 W Ceres Ave is a home with nearby schools including Oak Grove Elementary, Ridgeview Middle, and Redwood High School.
Ownership History
Date
Name
Owned For
Owner Type
Purchase Details
Closed on
Sep 6, 2017
Sold by
Galvan Lori L
Bought by
Galvan Rodrigo
Current Estimated Value
Home Financials for this Owner
Home Financials are based on the most recent Mortgage that was taken out on this home.
Original Mortgage
$248,360
Outstanding Balance
$207,013
Interest Rate
3.92%
Mortgage Type
New Conventional
Estimated Equity
$292,617
Purchase Details
Closed on
Aug 1, 2017
Sold by
Lennar Homes Of California Inc
Bought by
Galvan Rodrigo
Home Financials for this Owner
Home Financials are based on the most recent Mortgage that was taken out on this home.
Original Mortgage
$248,360
Outstanding Balance
$207,013
Interest Rate
3.92%
Mortgage Type
New Conventional
Estimated Equity
$292,617
Purchase Details
Closed on
Mar 2, 2016
Sold by
Lv Silver 7 Llc
Bought by
Lennar Homes Of California Inc
Purchase Details
Closed on
Nov 9, 2015
Sold by
Lv Silver 7 Llc
Bought by
Lv Silver 7 Ii Llc
Purchase Details
Closed on
Dec 19, 2007
Sold by
Reynen & Bardis Communities Inc
Bought by
Lv Silver 7
Create a Home Valuation Report for This Property
The Home Valuation Report is an in-depth analysis detailing your home's value as well as a comparison with similar homes in the area
Home Values in the Area
Average Home Value in this Area
Purchase History
| Date | Buyer | Sale Price | Title Company |
|---|---|---|---|
| Galvan Rodrigo | -- | North American Title Co Inc | |
| Galvan Rodrigo | $310,500 | North American Title Company | |
| Lennar Homes Of California Inc | $3,061,500 | North American Title Co Inc | |
| Lv Silver 7 Ii Llc | -- | Accommodation | |
| Lv Silver 7 | $3,400,000 | None Available |
Source: Public Records
Mortgage History
| Date | Status | Borrower | Loan Amount |
|---|---|---|---|
| Open | Galvan Rodrigo | $248,360 |
Source: Public Records
Tax History Compared to Growth
Tax History
| Year | Tax Paid | Tax Assessment Tax Assessment Total Assessment is a certain percentage of the fair market value that is determined by local assessors to be the total taxable value of land and additions on the property. | Land | Improvement |
|---|---|---|---|---|
| 2025 | $4,056 | $352,725 | $84,198 | $268,527 |
| 2024 | $4,056 | $345,810 | $82,548 | $263,262 |
| 2023 | $3,954 | $339,030 | $80,930 | $258,100 |
| 2022 | $3,762 | $332,384 | $79,344 | $253,040 |
| 2021 | $3,766 | $325,866 | $77,788 | $248,078 |
| 2020 | $3,745 | $322,524 | $76,990 | $245,534 |
| 2019 | $3,639 | $316,200 | $75,480 | $240,720 |
| 2018 | $3,563 | $310,000 | $74,000 | $236,000 |
| 2017 | $1,061 | $73,950 | $73,950 | $0 |
| 2016 | $753 | $44,383 | $44,383 | $0 |
| 2015 | $747 | $43,716 | $43,716 | $0 |
| 2014 | $656 | $35,000 | $35,000 | $0 |
Source: Public Records
Map
Nearby Homes
- Lark Plan at Victory Oaks
- Oxford Plan at Victory Oaks
- 2334 N Fontana St
- Cardinal Plan at Victory Oaks
- Sparrow Plan at Victory Oaks
- Oriole Plan at Victory Oaks
- 2334 N Fontana St Unit 2042v
- 2319 N Fontana St
- 2326 N Fontana St
- Wren Plan at Victory Oaks
- 2335 N Fontana St Unit 2009v
- 2338 N Fontana St Unit 2043v
- 2338 N Fontana St
- 2335 N Fontana St
- 2313 N Fontana St
- 2314 N Fontana St
- 3833 W Vine Ave
- 7930 W Sunnyview Ave
- 3842 W Buena Vista Ave
- 3615 W Sunnyview Ave
- 3728 W Ceres Ave
- 3748 W Ceres Ave
- 3804 W Ceres Ave
- 3735 W Ceres Ave
- 3747 W Ceres Ave
- 3727 W Ceres Ave
- 3818 W Ceres Ave
- 2150 N Fulgham St
- 3805 W Ceres Ave
- 2144 N Fulgham St
- 3826 W Ceres Ave
- 3819 W Ceres Ct
- 3819 W Ceres Ave
- 2138 N Fulgham St Unit 10
- 2138 N Fulgham St
- 3734 W Clinton Ave
- 3740 W Clinton Ave
- 3740 W Clinton Ave Unit 40
- 3726 W Clinton Ave
- 3827 W Ceres Ave