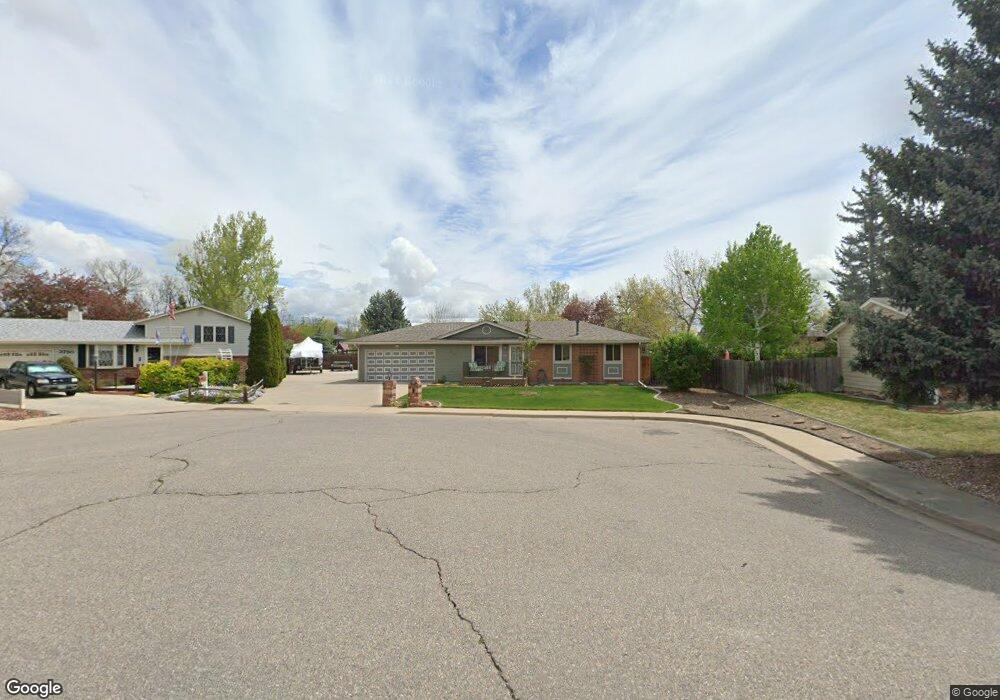
3738 Chestnut Ct Loveland, CO 80538
Estimated Value: $443,714 - $478,000
4
Beds
2
Baths
2,040
Sq Ft
$229/Sq Ft
Est. Value
About This Home
This home is located at 3738 Chestnut Ct, Loveland, CO 80538 and is currently estimated at $468,179, approximately $229 per square foot. 3738 Chestnut Ct is a home located in Larimer County with nearby schools including Lincoln Elementary School, Lucile Erwin Middle School, and Loveland High School.
Ownership History
Date
Name
Owned For
Owner Type
Purchase Details
Closed on
Dec 20, 2012
Sold by
Lease Larry A and Adams Loretta F
Bought by
Lease Larry A and Lease Loretta F
Current Estimated Value
Home Financials for this Owner
Home Financials are based on the most recent Mortgage that was taken out on this home.
Original Mortgage
$179,500
Outstanding Balance
$124,364
Interest Rate
3.37%
Mortgage Type
New Conventional
Estimated Equity
$343,815
Purchase Details
Closed on
Mar 8, 2005
Sold by
Harmon Ronald E and Harmon Colleen K
Bought by
Lease Larry A and Adams Loretta F
Home Financials for this Owner
Home Financials are based on the most recent Mortgage that was taken out on this home.
Original Mortgage
$172,000
Interest Rate
5.71%
Mortgage Type
Purchase Money Mortgage
Purchase Details
Closed on
Sep 1, 1990
Bought by
Harmon Ronald E
Create a Home Valuation Report for This Property
The Home Valuation Report is an in-depth analysis detailing your home's value as well as a comparison with similar homes in the area
Home Values in the Area
Average Home Value in this Area
Purchase History
| Date | Buyer | Sale Price | Title Company |
|---|---|---|---|
| Lease Larry A | -- | Land Title Guarantee Company | |
| Lease Larry A | $215,000 | Fahtco | |
| Harmon Ronald E | $77,000 | -- |
Source: Public Records
Mortgage History
| Date | Status | Borrower | Loan Amount |
|---|---|---|---|
| Open | Lease Larry A | $179,500 | |
| Closed | Lease Larry A | $172,000 | |
| Closed | Lease Larry A | $32,250 |
Source: Public Records
Tax History Compared to Growth
Tax History
| Year | Tax Paid | Tax Assessment Tax Assessment Total Assessment is a certain percentage of the fair market value that is determined by local assessors to be the total taxable value of land and additions on the property. | Land | Improvement |
|---|---|---|---|---|
| 2025 | $2,244 | $31,805 | $3,350 | $28,455 |
| 2024 | $2,164 | $31,805 | $3,350 | $28,455 |
| 2022 | $1,931 | $24,269 | $3,475 | $20,794 |
| 2021 | $1,984 | $24,968 | $3,575 | $21,393 |
| 2020 | $1,783 | $22,422 | $3,575 | $18,847 |
| 2019 | $1,753 | $22,422 | $3,575 | $18,847 |
| 2018 | $1,628 | $19,786 | $3,600 | $16,186 |
| 2017 | $1,402 | $19,786 | $3,600 | $16,186 |
| 2016 | $1,256 | $17,130 | $3,980 | $13,150 |
| 2015 | $1,246 | $17,130 | $3,980 | $13,150 |
| 2014 | $1,087 | $14,460 | $3,980 | $10,480 |
Source: Public Records
Map
Nearby Homes
- 1221 Bay Ct
- 717 W 36th St
- 4056 Boxelder Dr
- 3523 N Franklin Ave
- 3621 Adena Ct
- 4150 Ebony Ct
- 3312 N Colorado Ave
- 1463 Caddoa Dr
- 3750 Sheridan Ave
- 4019 Burr Oak Dr
- 3210 N Colorado Ave
- 4403 Shubert Dr
- 3638 Butternut Dr Unit 7A
- 1532 Oak Creek Dr
- 3321 Butternut Dr
- 3110 N Franklin Ave
- 1555 Oak Creek Dr
- 4406 Chateau Dr
- 2922 Alamosa Ct
- 1266 W 45th St
- 3750 Chestnut Ct
- 3739 Duffield Ave
- 3726 Chestnut Ct
- 3727 Duffield Ave
- 3751 Duffield Ave
- 3763 Chestnut Ct
- 1016 Banyan Ct
- 3714 Chestnut Ct
- 3715 Duffield Ave
- 1028 Banyan Ct
- 1004 Banyan Ct
- 3739 Chestnut Ct
- 3751 Chestnut Ct
- 3727 Chestnut Ct
- 1040 Banyan Ct
- 3702 Chestnut Ct
- 1017 W 37th St
- 3715 Chestnut Ct
- 951 Black Maple Dr
- 1064 Banyan Ct