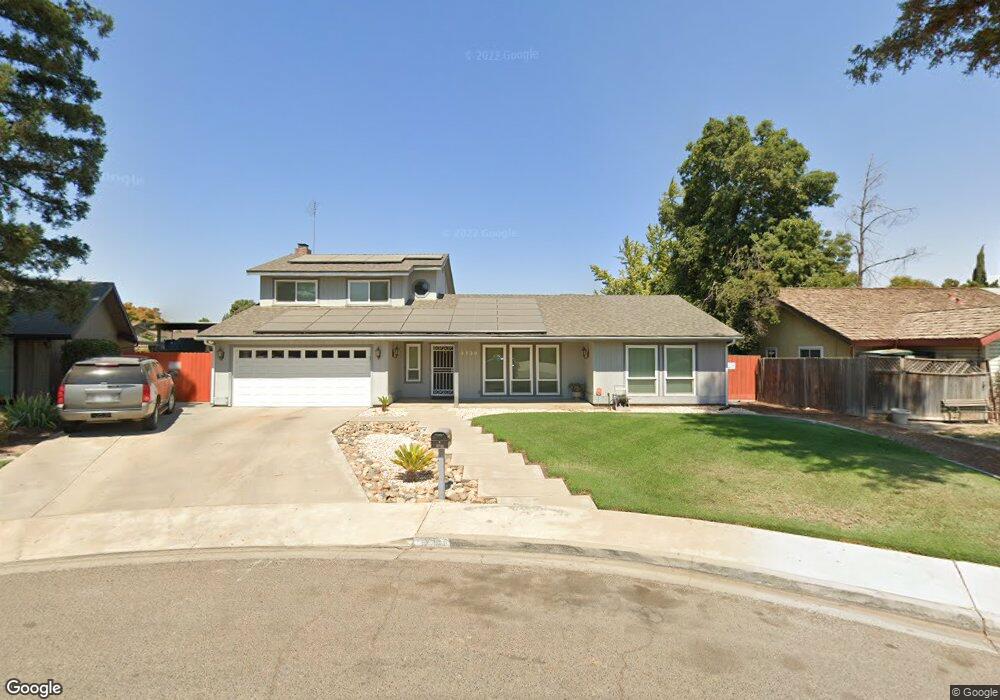
3738 W Monte Vista Ct Visalia, CA 93277
Estimated Value: $395,000 - $513,000
3
Beds
2
Baths
2,259
Sq Ft
$205/Sq Ft
Est. Value
About This Home
This home is located at 3738 W Monte Vista Ct, Visalia, CA 93277 and is currently estimated at $462,381, approximately $204 per square foot. 3738 W Monte Vista Ct is a home located in Tulare County with nearby schools including Crestwood Elementary School, La Joya Middle School, and El Diamante High School.
Ownership History
Date
Name
Owned For
Owner Type
Purchase Details
Closed on
May 16, 2007
Sold by
Perry Steve Eugene
Bought by
Darrington Byron W and Darrington Belynda E
Current Estimated Value
Home Financials for this Owner
Home Financials are based on the most recent Mortgage that was taken out on this home.
Original Mortgage
$280,250
Outstanding Balance
$170,002
Interest Rate
6.12%
Mortgage Type
Purchase Money Mortgage
Estimated Equity
$292,379
Purchase Details
Closed on
Nov 21, 2006
Sold by
Battle Ronald K
Bought by
Perry Steve Eugene and Perry Irene Marie
Purchase Details
Closed on
Jul 23, 1997
Sold by
Farhang Robin
Bought by
Battle Ronald Keith and Battle Melissa Lynn
Home Financials for this Owner
Home Financials are based on the most recent Mortgage that was taken out on this home.
Original Mortgage
$133,000
Interest Rate
7.7%
Purchase Details
Closed on
Jul 17, 1995
Sold by
Farhang Teymour
Bought by
Farhang Robin
Create a Home Valuation Report for This Property
The Home Valuation Report is an in-depth analysis detailing your home's value as well as a comparison with similar homes in the area
Home Values in the Area
Average Home Value in this Area
Purchase History
| Date | Buyer | Sale Price | Title Company |
|---|---|---|---|
| Darrington Byron W | $295,000 | None Available | |
| Perry Steve Eugene | $120,000 | None Available | |
| Battle Ronald Keith | $140,000 | Chicago Title Co | |
| Farhang Robin | -- | -- |
Source: Public Records
Mortgage History
| Date | Status | Borrower | Loan Amount |
|---|---|---|---|
| Open | Darrington Byron W | $280,250 | |
| Previous Owner | Battle Ronald Keith | $133,000 |
Source: Public Records
Tax History Compared to Growth
Tax History
| Year | Tax Paid | Tax Assessment Tax Assessment Total Assessment is a certain percentage of the fair market value that is determined by local assessors to be the total taxable value of land and additions on the property. | Land | Improvement |
|---|---|---|---|---|
| 2025 | $4,085 | $395,233 | $113,880 | $281,353 |
| 2024 | $4,085 | $387,485 | $111,648 | $275,837 |
| 2023 | $3,971 | $379,888 | $109,459 | $270,429 |
| 2022 | $3,792 | $372,440 | $107,313 | $265,127 |
| 2021 | $3,796 | $365,137 | $105,209 | $259,928 |
| 2020 | $3,556 | $341,000 | $85,000 | $256,000 |
| 2019 | $3,378 | $328,000 | $82,000 | $246,000 |
| 2018 | $3,231 | $315,000 | $79,000 | $236,000 |
| 2017 | $3,021 | $293,000 | $73,000 | $220,000 |
| 2016 | $2,925 | $283,000 | $71,000 | $212,000 |
| 2015 | $2,570 | $277,000 | $69,000 | $208,000 |
| 2014 | $2,570 | $248,000 | $62,000 | $186,000 |
Source: Public Records
Map
Nearby Homes
- 0 S Silvervale Unit 231829
- 2650 S Chinowth St
- 3737 W Victor Ave
- 4301 S University St
- 2223 S Julieann St Unit 1032v
- 2346 S Julieann St Unit 1067v
- 4239 W Mary Ave
- 3924 W Fairhaven Ave
- 3504 W Cutler Ave
- 3045 W Victor Ave
- 3116 W Beech Ave
- 4523 W Evergreen Ct
- 2724 S County Center Dr
- 2801 S Kent Ct
- 1937 S Royal Oaks Dr
- 2820 W Dorothea Ave
- 2650 S Linda Vista St
- 2743 W Sunnyside Ave
- 2944 S Verde Vista St
- 4746 W Ashland Ave
- 3738 W Monte Vista Ave
- 3724 W Monte Vista Ct
- 3744 W Monte Vista Ct
- 3735 W Whitendale Ave
- 3741 W Whitendale Ave
- 3725 W Whitendale Ave
- 3712 W Monte Vista Ct
- 3749 W Whitendale Ave
- 3713 W Whitendale Ave
- 3810 W Monte Vista Ave
- 3745 W Monte Vista Ct
- 3737 W Monte Vista Ct
- 3725 W Monte Vista Ct
- 3811 W Whitendale Ave
- 2900 S Fulgham St
- 3713 W Monte Vista Ct
- 3820 W Monte Vista Ave
- 3545 W Monte Vista Ave
- 3730 W Whitendale Ave
- 3740 W Whitendale Ave