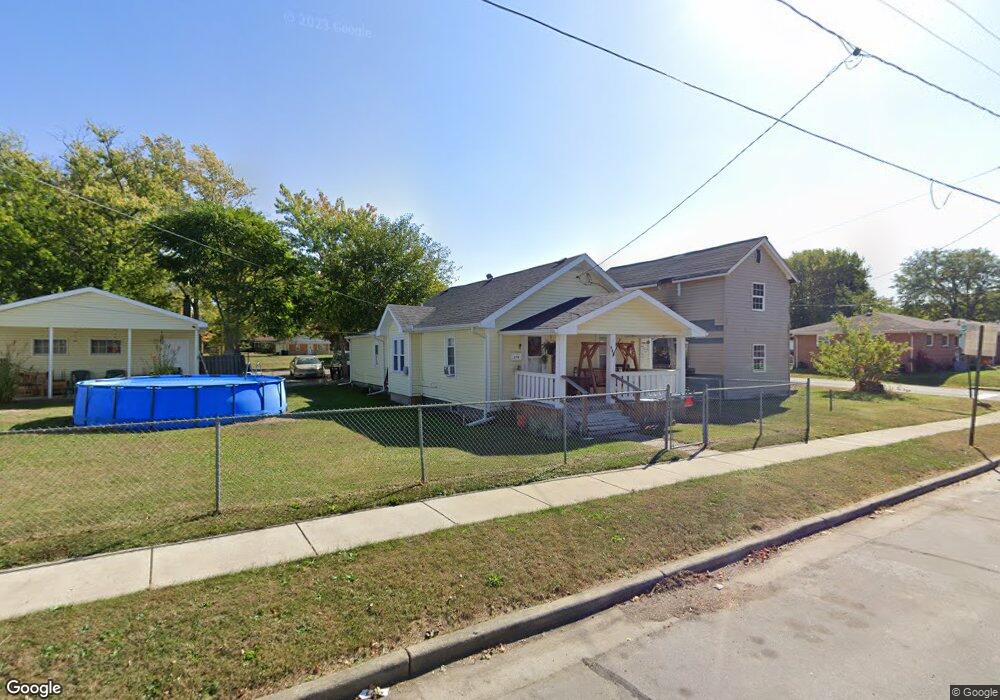
374 Clinton St Marion, OH 43302
Estimated Value: $86,103 - $128,000
3
Beds
1
Bath
1,188
Sq Ft
$88/Sq Ft
Est. Value
About This Home
This home is located at 374 Clinton St, Marion, OH 43302 and is currently estimated at $105,026, approximately $88 per square foot. 374 Clinton St is a home located in Marion County with nearby schools including James A. Garfield Elementary School, Ulysses S. Grant Middle School, and Harding High School.
Ownership History
Date
Name
Owned For
Owner Type
Purchase Details
Closed on
Apr 28, 2020
Sold by
Tolle Ronald L
Bought by
Seckel Connie L
Current Estimated Value
Home Financials for this Owner
Home Financials are based on the most recent Mortgage that was taken out on this home.
Original Mortgage
$64,125
Outstanding Balance
$57,140
Interest Rate
3.6%
Mortgage Type
New Conventional
Estimated Equity
$47,886
Purchase Details
Closed on
Dec 12, 2019
Sold by
Lines Bobbi Jo and Jones Bobbi Jo
Bought by
Tolle Ronald L
Purchase Details
Closed on
Jun 30, 2006
Sold by
Gamble Tollie and Gamble Ethel
Bought by
Lines Bobbi Jo
Home Financials for this Owner
Home Financials are based on the most recent Mortgage that was taken out on this home.
Original Mortgage
$68,500
Interest Rate
10.05%
Mortgage Type
Adjustable Rate Mortgage/ARM
Purchase Details
Closed on
Oct 18, 2002
Bought by
Lines Bobbi Jo
Create a Home Valuation Report for This Property
The Home Valuation Report is an in-depth analysis detailing your home's value as well as a comparison with similar homes in the area
Home Values in the Area
Average Home Value in this Area
Purchase History
| Date | Buyer | Sale Price | Title Company |
|---|---|---|---|
| Seckel Connie L | $67,500 | None Available | |
| Tolle Ronald L | $30,000 | None Available | |
| Lines Bobbi Jo | $68,500 | Professtional Closing Title | |
| Lines Bobbi Jo | $55,000 | -- |
Source: Public Records
Mortgage History
| Date | Status | Borrower | Loan Amount |
|---|---|---|---|
| Open | Seckel Connie L | $64,125 | |
| Previous Owner | Lines Bobbi Jo | $68,500 |
Source: Public Records
Tax History Compared to Growth
Tax History
| Year | Tax Paid | Tax Assessment Tax Assessment Total Assessment is a certain percentage of the fair market value that is determined by local assessors to be the total taxable value of land and additions on the property. | Land | Improvement |
|---|---|---|---|---|
| 2024 | $1,044 | $18,450 | $1,210 | $17,240 |
| 2023 | $1,044 | $18,450 | $1,210 | $17,240 |
| 2022 | $658 | $18,450 | $1,210 | $17,240 |
| 2021 | $658 | $16,610 | $1,050 | $15,560 |
| 2020 | $660 | $16,610 | $1,050 | $15,560 |
| 2019 | $868 | $16,610 | $1,050 | $15,560 |
| 2018 | $784 | $15,830 | $1,050 | $14,780 |
| 2017 | $907 | $15,830 | $1,050 | $14,780 |
| 2016 | $615 | $15,830 | $1,050 | $14,780 |
| 2015 | $615 | $15,490 | $1,000 | $14,490 |
| 2014 | $617 | $15,490 | $1,000 | $14,490 |
| 2012 | $665 | $16,610 | $1,400 | $15,210 |
Source: Public Records
Map
Nearby Homes
- 383 Brentwood Dr
- 472 Clinton St
- 407 Latourette St
- 403 Uncapher Ave
- 625 Rochelle Dr
- 213 Sharp St
- 889 Oak Grove Ave
- 512 Henry St
- 824 Oak Grove Ave
- 1117 Woodrow Ave
- 645 Henry St
- 668 Uncapher Ave
- 904 Merkle Ave
- 796 Woodrow Ave
- 716 Uncapher Ave
- 681 Davids St
- 720 Woodrow Ave
- 355 Lee St
- 715 Woodrow Ave
- 757 Merkle Ave