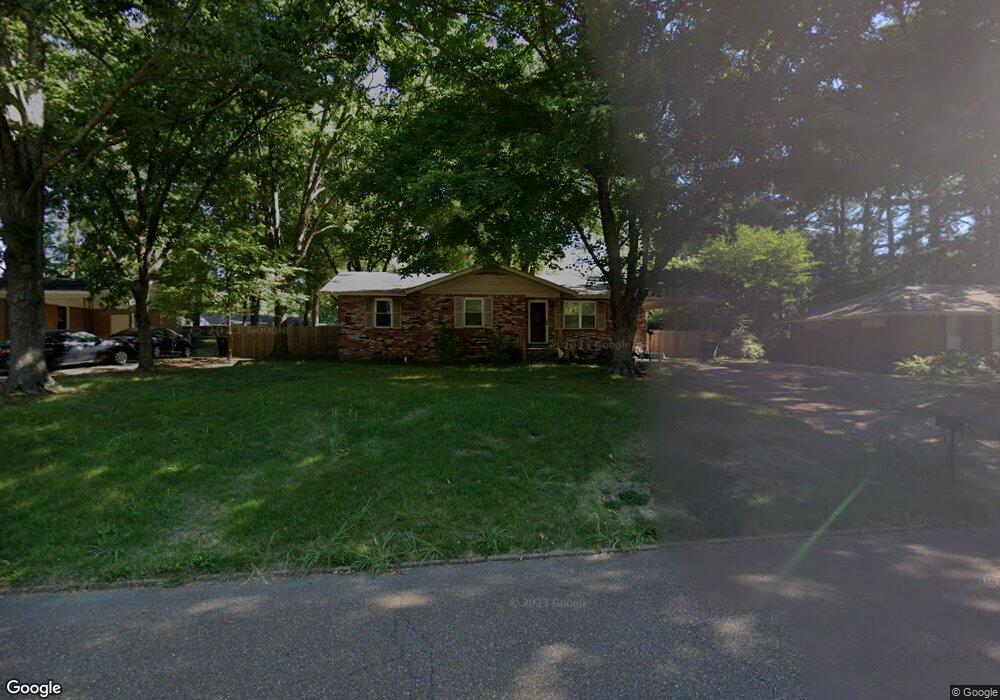
374 W Robinson St Hernando, MS 38632
Estimated Value: $220,570 - $262,000
3
Beds
--
Bath
1,475
Sq Ft
$166/Sq Ft
Est. Value
About This Home
This home is located at 374 W Robinson St, Hernando, MS 38632 and is currently estimated at $244,143, approximately $165 per square foot. 374 W Robinson St is a home located in DeSoto County with nearby schools including Oak Grove Central Elementary School, Hernando Elementary School, and Hernando Hills Elementary.
Ownership History
Date
Name
Owned For
Owner Type
Purchase Details
Closed on
Oct 22, 2021
Sold by
Clemons Dallas E Langley
Bought by
Clemons Dallas E Langley and Clemons Charles Christopher
Current Estimated Value
Home Financials for this Owner
Home Financials are based on the most recent Mortgage that was taken out on this home.
Original Mortgage
$112,000
Outstanding Balance
$101,689
Interest Rate
2.8%
Mortgage Type
New Conventional
Estimated Equity
$142,454
Purchase Details
Closed on
Jul 18, 2017
Sold by
Langley Paula J
Bought by
Langley Clemons Dallas E
Home Financials for this Owner
Home Financials are based on the most recent Mortgage that was taken out on this home.
Original Mortgage
$55,000
Interest Rate
3.9%
Mortgage Type
New Conventional
Purchase Details
Closed on
Nov 30, 2016
Sold by
Langley Paula J
Bought by
Langley Clemons Dallas Elizabeth
Create a Home Valuation Report for This Property
The Home Valuation Report is an in-depth analysis detailing your home's value as well as a comparison with similar homes in the area
Home Values in the Area
Average Home Value in this Area
Purchase History
| Date | Buyer | Sale Price | Title Company |
|---|---|---|---|
| Clemons Dallas E Langley | -- | Quality Title Group Llc | |
| Langley Clemons Dallas E | -- | None Available | |
| Langley Clemons Dallas Elizabeth | -- | None Available |
Source: Public Records
Mortgage History
| Date | Status | Borrower | Loan Amount |
|---|---|---|---|
| Open | Clemons Dallas E Langley | $112,000 | |
| Closed | Langley Clemons Dallas E | $55,000 |
Source: Public Records
Tax History
| Year | Tax Paid | Tax Assessment Tax Assessment Total Assessment is a certain percentage of the fair market value that is determined by local assessors to be the total taxable value of land and additions on the property. | Land | Improvement |
|---|---|---|---|---|
| 2025 | $1,328 | $11,402 | $2,500 | $8,902 |
| 2024 | $1,196 | $8,618 | $2,500 | $6,118 |
| 2023 | $1,196 | $8,618 | $0 | $0 |
| 2022 | $1,196 | $8,618 | $2,500 | $6,118 |
| 2021 | $896 | $8,618 | $2,500 | $6,118 |
| 2020 | $828 | $8,128 | $0 | $0 |
| 2019 | $828 | $8,128 | $2,500 | $5,628 |
| 2017 | $809 | $13,402 | $7,951 | $5,451 |
| 2016 | $762 | $7,950 | $2,500 | $5,450 |
| 2015 | $1,062 | $13,400 | $7,950 | $5,450 |
| 2014 | $737 | $7,950 | $0 | $0 |
| 2013 | $688 | $7,950 | $0 | $0 |
Source: Public Records
Map
Nearby Homes
- 2035 Highway 51 S
- 313 Northwood Hills Dr
- 5 W Commerce St
- 101 E Valley St
- 0 Southern St
- 186 E South St
- 1770 Robertson Place Dr
- 120 N Parkway St
- 2948 Caffey St
- 2615 Jaxon Dr
- 1679 Sandpiper Cove N
- 695 Robertson Way
- 1 E Oak Grove Rd
- 250 Vaiden Ridge Cove
- 270 Gaslight Cove
- 1249 Howell Way
- 509 Howell Way
- 3524 Williams Brooke Ln
- 406 Vaiden Ridge Dr S
- 1207 Howell Way
- 390 W Robinson St
- 354 W Robinson St
- 2144 Gale Cove
- 408 W Robinson St
- 2151 Gale Cove
- 340 W Robinson St
- 371 W Robinson St
- 2128 Gale Cove
- 361 W Robinson St
- 393 W Robinson St
- 424 W Robinson St
- 2165 Highway 51 S
- 2165 Highway 51 S
- 351 W Robinson St
- 2145 Gale Cove
- 2211 West St
- 2110 Gale Cove
- 331 W Robinson St
- 440 W Robinson St
- 2105 Highway 51 S
Your Personal Tour Guide
Ask me questions while you tour the home.