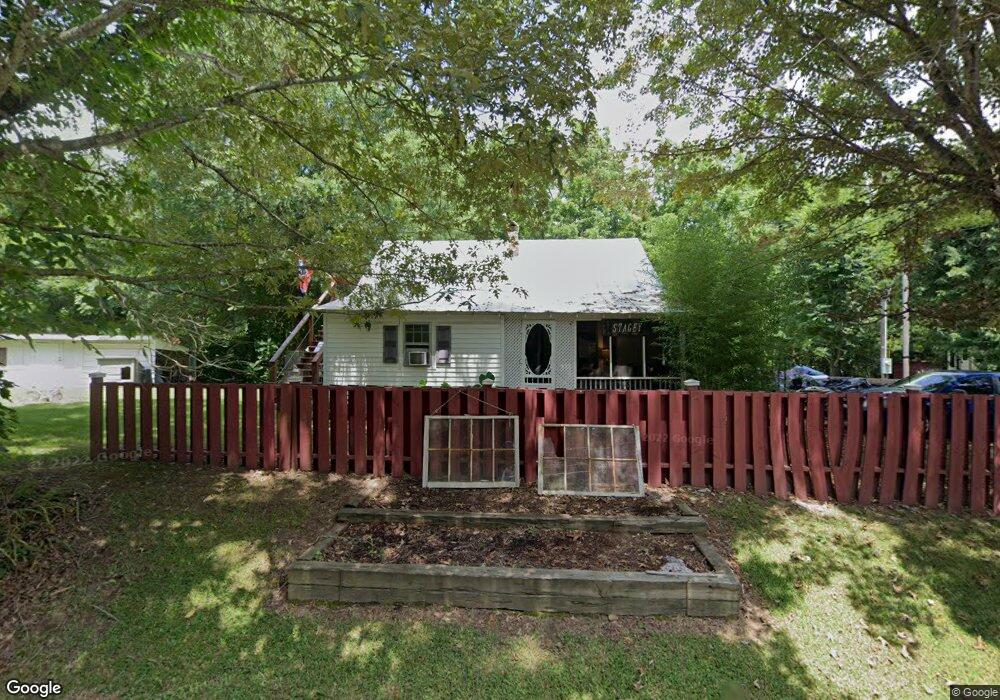
374 W Shellsford Rd McMinnville, TN 37110
Estimated Value: $135,000 - $254,000
--
Bed
1
Bath
745
Sq Ft
$259/Sq Ft
Est. Value
About This Home
This home is located at 374 W Shellsford Rd, McMinnville, TN 37110 and is currently estimated at $192,709, approximately $258 per square foot. 374 W Shellsford Rd is a home located in Warren County with nearby schools including Hickory Creek Elementary School, Warren County Middle School, and Warren County High School.
Ownership History
Date
Name
Owned For
Owner Type
Purchase Details
Closed on
Jun 22, 2023
Sold by
Winton Manuel Dale
Bought by
Winton Kelly D
Current Estimated Value
Home Financials for this Owner
Home Financials are based on the most recent Mortgage that was taken out on this home.
Original Mortgage
$63,798
Outstanding Balance
$62,092
Interest Rate
6.39%
Mortgage Type
New Conventional
Estimated Equity
$130,617
Purchase Details
Closed on
Feb 20, 2010
Sold by
Stacey Jennifer Michelle
Bought by
Winton Dale
Purchase Details
Closed on
Feb 20, 2009
Bought by
Winton Dale
Purchase Details
Closed on
Aug 7, 2007
Sold by
Winton Dale
Bought by
Stacey Jennifer Michelle
Purchase Details
Closed on
Apr 2, 1996
Bought by
Winton Dale
Purchase Details
Closed on
May 13, 1986
Bought by
Winton Berdie
Create a Home Valuation Report for This Property
The Home Valuation Report is an in-depth analysis detailing your home's value as well as a comparison with similar homes in the area
Home Values in the Area
Average Home Value in this Area
Purchase History
| Date | Buyer | Sale Price | Title Company |
|---|---|---|---|
| Winton Kelly D | -- | None Listed On Document | |
| Winton Dale | $41,900 | -- | |
| Winton Dale | $41,900 | -- | |
| Stacey Jennifer Michelle | $35,000 | -- | |
| Winton Dale | $20,200 | -- | |
| Winton Berdie | -- | -- |
Source: Public Records
Mortgage History
| Date | Status | Borrower | Loan Amount |
|---|---|---|---|
| Open | Winton Kelly D | $63,798 |
Source: Public Records
Tax History Compared to Growth
Tax History
| Year | Tax Paid | Tax Assessment Tax Assessment Total Assessment is a certain percentage of the fair market value that is determined by local assessors to be the total taxable value of land and additions on the property. | Land | Improvement |
|---|---|---|---|---|
| 2024 | $709 | $36,050 | $5,700 | $30,350 |
| 2023 | $709 | $36,050 | $5,700 | $30,350 |
| 2022 | $709 | $36,050 | $5,700 | $30,350 |
| 2021 | $709 | $36,050 | $5,700 | $30,350 |
| 2020 | $488 | $36,050 | $5,700 | $30,350 |
| 2019 | $557 | $24,800 | $4,875 | $19,925 |
| 2018 | $488 | $24,800 | $4,875 | $19,925 |
| 2017 | $488 | $24,800 | $4,875 | $19,925 |
| 2016 | $435 | $22,100 | $4,875 | $17,225 |
| 2015 | $200 | $10,025 | $4,875 | $5,150 |
| 2014 | $204 | $10,025 | $4,875 | $5,150 |
| 2013 | $204 | $10,219 | $0 | $0 |
Source: Public Records
Map
Nearby Homes
- 122 Mount Leo Heights St
- 220 Higginbotham Rd
- 240 Kennedy St
- 488 Sunset Point Rd
- 103 Harrison Ferry Rd
- 103 AC Harrison Ferry Rd
- 610 Sunset Point Rd
- 100 Holly St
- 215 Orchard Ln
- 252 Dawn Dr
- 0 Tennessee 8
- 0 Higginbotham Rd
- 117 Crain St
- 1867 Shellsford Rd
- 102 W Sparta St
- 114 Oak St
- 211 S High St Unit 22
- 209 S High St Unit 19
- 107 Grundy St
- 215 W Sparta St
- 131 Mount Leo Heights St
- 201 Mount Leo Heights St
- 205 Mount Leo Heights St
- 125 Mount Leo Heights St
- 207 Mount Leo Heights St
- 447 W Shellsford Rd
- 0 Mount Leo Heights St
- 121 Mount Leo Heights St
- 211 Mount Leo Heights St
- 482 W Shellsford Rd
- 130 Mount Leo Heights St
- 202 Mount Leo Heights St
- 204 Mount Leo Heights St
- 107 Mount Leo Heights St
- 328 W Shellsford Rd
- 217 Mount Leo Heights St
- 0 Beersheba Hwy Unit 1938903
- 0 Beersheba Hwy Unit RTC2644470
- 0 Beersheba Hwy Unit 144916
- 0 Beersheba Hwy Unit RTC1564739