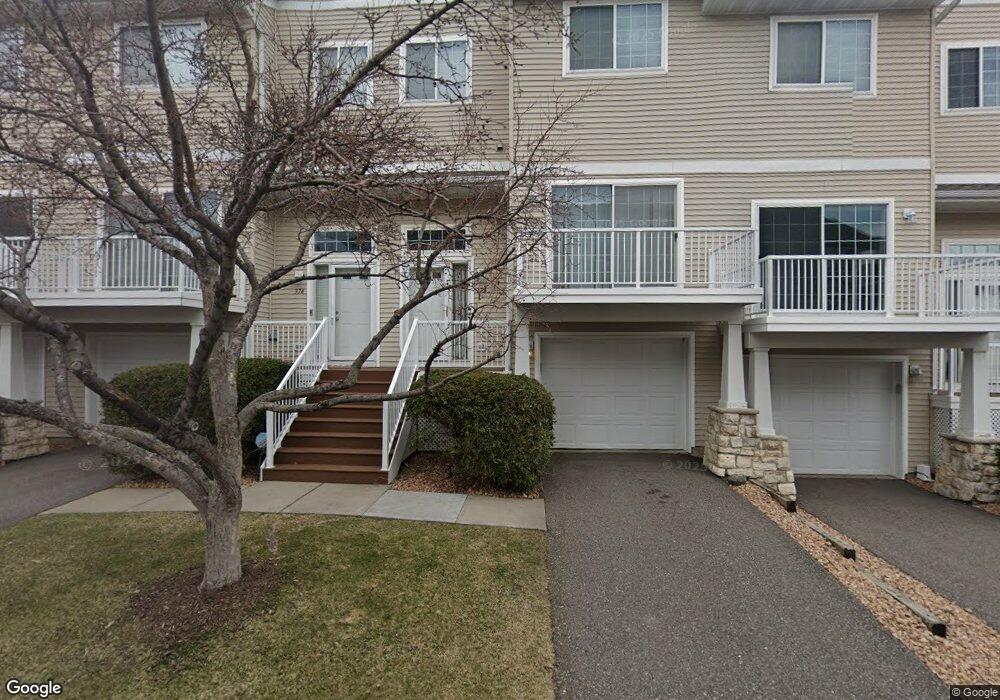
374 Willoughby Way W Unit 110 Hopkins, MN 55305
Estimated Value: $289,000 - $311,000
2
Beds
2
Baths
1,208
Sq Ft
$250/Sq Ft
Est. Value
About This Home
This home is located at 374 Willoughby Way W Unit 110, Hopkins, MN 55305 and is currently estimated at $301,797, approximately $249 per square foot. 374 Willoughby Way W Unit 110 is a home located in Hennepin County with nearby schools including L.H. Tanglen Elementary School, Hopkins North Junior High School, and Hopkins Senior High School.
Ownership History
Date
Name
Owned For
Owner Type
Purchase Details
Closed on
Sep 24, 2021
Sold by
Brunson Rebekkah and Lamar Bobbi Jo
Bought by
Tortelli Jeffrey C
Current Estimated Value
Purchase Details
Closed on
Sep 28, 2018
Sold by
Cassady Bridget Ann
Bought by
Brunson Rebekkah and Lamar Bobbi Jo
Home Financials for this Owner
Home Financials are based on the most recent Mortgage that was taken out on this home.
Original Mortgage
$170,000
Interest Rate
4.6%
Mortgage Type
Commercial
Purchase Details
Closed on
Dec 8, 2014
Sold by
Keswani Anju
Bought by
Cassady Bridget Ann
Home Financials for this Owner
Home Financials are based on the most recent Mortgage that was taken out on this home.
Original Mortgage
$136,000
Interest Rate
3.97%
Mortgage Type
New Conventional
Purchase Details
Closed on
Jul 22, 2004
Sold by
Johnson Tonya R Huff
Bought by
Keswani Anju
Purchase Details
Closed on
Sep 15, 2000
Sold by
Minnstar Builders
Bought by
Huff Tonya R
Create a Home Valuation Report for This Property
The Home Valuation Report is an in-depth analysis detailing your home's value as well as a comparison with similar homes in the area
Home Values in the Area
Average Home Value in this Area
Purchase History
| Date | Buyer | Sale Price | Title Company |
|---|---|---|---|
| Tortelli Jeffrey C | $250,000 | Watermark Title Agency | |
| Brunson Rebekkah | $212,900 | Burnet Title | |
| Cassady Bridget Ann | $170,000 | Burnet Title | |
| Keswani Anju | $215,000 | -- | |
| Huff Tonya R | $133,000 | -- |
Source: Public Records
Mortgage History
| Date | Status | Borrower | Loan Amount |
|---|---|---|---|
| Previous Owner | Brunson Rebekkah | $170,000 | |
| Previous Owner | Cassady Bridget Ann | $136,000 |
Source: Public Records
Tax History Compared to Growth
Tax History
| Year | Tax Paid | Tax Assessment Tax Assessment Total Assessment is a certain percentage of the fair market value that is determined by local assessors to be the total taxable value of land and additions on the property. | Land | Improvement |
|---|---|---|---|---|
| 2024 | $3,318 | $288,700 | $44,000 | $244,700 |
| 2023 | $3,228 | $283,400 | $44,000 | $239,400 |
| 2022 | $2,784 | $254,600 | $44,000 | $210,600 |
| 2021 | $2,495 | $235,800 | $40,000 | $195,800 |
| 2020 | $2,559 | $216,900 | $40,000 | $176,900 |
| 2019 | $2,319 | $211,500 | $40,000 | $171,500 |
| 2018 | $2,238 | $196,000 | $40,000 | $156,000 |
| 2017 | $2,048 | $169,000 | $60,000 | $109,000 |
| 2016 | $2,042 | $164,600 | $60,000 | $104,600 |
| 2015 | $2,141 | $168,200 | $50,000 | $118,200 |
| 2014 | -- | $132,400 | $50,000 | $82,400 |
Source: Public Records
Map
Nearby Homes
- 324 Willoughby Way W
- 113 Willoughby Way E
- 11408 Oberlin Rd
- 2xx Deerwood Ln N
- 205 Deerwood Ln N
- 218 Deerwood Ln N
- 1411 Archwood Rd
- 350 Shelard Pkwy Unit 104
- 350 Shelard Pkwy Unit 206
- 400 Shelard Pkwy Unit 303
- 406 Zachary Ln N
- 425 Shelard Pkwy Unit 203
- 35 Nathan Ln N Unit 104
- 35 Nathan Ln N Unit 210
- 35 Nathan Ln N Unit 203
- 445 Shelard Pkwy Unit 104
- 11415 Sunset Trail
- 10605 Crestridge Dr
- 460 Ford Rd Unit 203
- 450 Ford Rd Unit 225
- 368 368 Willoughby-Way-w
- 376 376 Willoughby-Way-w
- 378 378 Willoughby-Way-w
- 324 324 Willoughby Way W
- 376 376 Willoughby Way W
- 368 368 Willoughby Way W
- 374 374 Willoughby Way W
- 368 Willoughby Way W
- 372 Willoughby Way W Unit 111
- 374 Willoughby Way W
- 378 Willoughby Way W Unit 108
- 320 Willoughby Way W Unit 107
- 322 Willoughby Way W Unit 106
- 328 Willoughby Way W Unit 103
- 330 Willoughby Way W
- 332 Willoughby Way W Unit 101
- 370 Willoughby Way W
- 326 Willoughby Way W Unit 104
- 370 Willoughby Way W Unit 112
- 366 Willoughby Way W