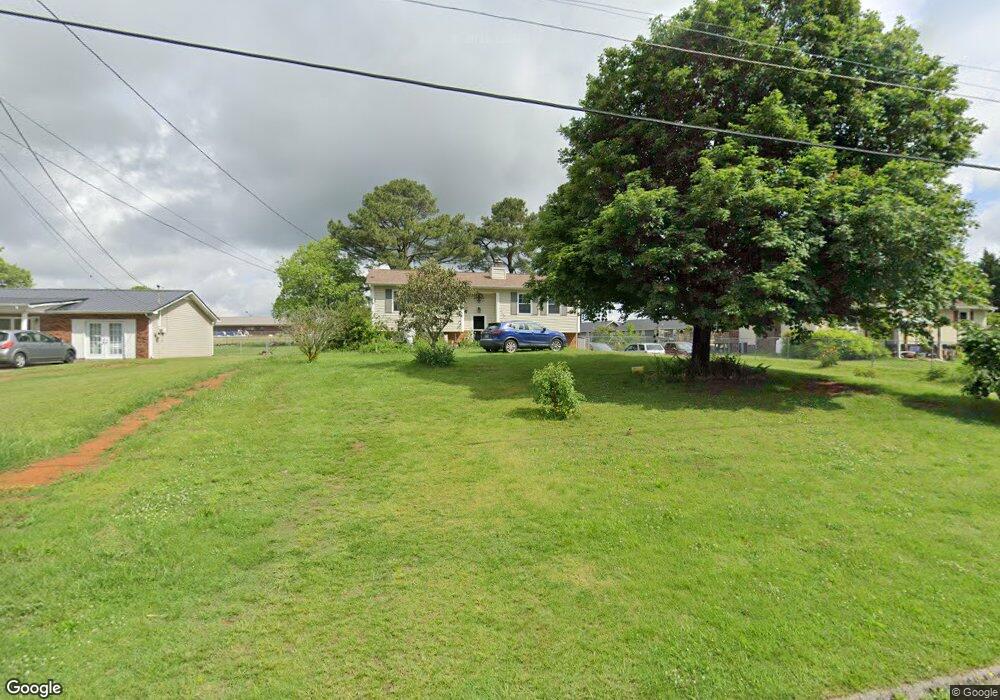
3740 Halifax Cir Morristown, TN 37813
Estimated Value: $215,000 - $286,000
--
Bed
2
Baths
1,052
Sq Ft
$242/Sq Ft
Est. Value
About This Home
This home is located at 3740 Halifax Cir, Morristown, TN 37813 and is currently estimated at $254,990, approximately $242 per square foot. 3740 Halifax Cir is a home located in Hamblen County with nearby schools including John Hay Elementary School, Meadowview Middle School, and Morristown East High School.
Ownership History
Date
Name
Owned For
Owner Type
Purchase Details
Closed on
Apr 15, 2003
Sold by
Secretary Of Housing And U
Bought by
Waites David A
Current Estimated Value
Home Financials for this Owner
Home Financials are based on the most recent Mortgage that was taken out on this home.
Original Mortgage
$76,302
Outstanding Balance
$32,418
Interest Rate
5.6%
Estimated Equity
$222,572
Purchase Details
Closed on
Nov 20, 2002
Sold by
Kinsler Stacy R
Bought by
Wells Fargo Home Mortgage
Purchase Details
Closed on
Sep 17, 2002
Bought by
Secretary Of H U D %Golden Feather Realty Ser
Purchase Details
Closed on
Mar 24, 2000
Sold by
Rogers R T Eva B
Bought by
Stacy Kinsler
Purchase Details
Closed on
Nov 6, 1985
Bought by
Rogers Rogers R and Rogers Eva B
Purchase Details
Closed on
Nov 5, 1982
Bought by
Hewitt David L and Hewitt Nena S
Purchase Details
Closed on
Sep 20, 1979
Bought by
Norton H V
Create a Home Valuation Report for This Property
The Home Valuation Report is an in-depth analysis detailing your home's value as well as a comparison with similar homes in the area
Home Values in the Area
Average Home Value in this Area
Purchase History
| Date | Buyer | Sale Price | Title Company |
|---|---|---|---|
| Waites David A | $77,500 | -- | |
| Wells Fargo Home Mortgage | -- | -- | |
| Secretary Of H U D %Golden Feather Realty Ser | $89,600 | -- | |
| Stacy Kinsler | $85,000 | -- | |
| Rogers Rogers R | $50,700 | -- | |
| Hewitt David L | -- | -- | |
| Norton H V | -- | -- |
Source: Public Records
Mortgage History
| Date | Status | Borrower | Loan Amount |
|---|---|---|---|
| Open | Norton H V | $76,302 |
Source: Public Records
Tax History Compared to Growth
Tax History
| Year | Tax Paid | Tax Assessment Tax Assessment Total Assessment is a certain percentage of the fair market value that is determined by local assessors to be the total taxable value of land and additions on the property. | Land | Improvement |
|---|---|---|---|---|
| 2024 | $603 | $30,600 | $6,375 | $24,225 |
| 2023 | $603 | $30,600 | $0 | $0 |
| 2022 | $603 | $30,600 | $6,375 | $24,225 |
| 2021 | $603 | $30,600 | $6,375 | $24,225 |
| 2020 | $603 | $30,600 | $6,375 | $24,225 |
| 2019 | $583 | $27,350 | $6,250 | $21,100 |
| 2018 | $583 | $27,350 | $6,250 | $21,100 |
| 2017 | $583 | $27,350 | $6,250 | $21,100 |
| 2016 | $544 | $27,350 | $6,250 | $21,100 |
| 2015 | $506 | $27,350 | $6,250 | $21,100 |
| 2014 | -- | $27,350 | $6,250 | $21,100 |
| 2013 | -- | $29,375 | $0 | $0 |
Source: Public Records
Map
Nearby Homes
- 3661 Halifax Cir
- Lot 1 E Andrew Johnson Hwy
- 3115 Eloise Dr
- 542 Cliff St
- 3003 Eloise Dr
- 358 Dover Rd
- 512 Cliff St
- 517 Cliff St
- 4270 Brockland Dr
- 1689 Carroll Rd
- 3113 Berna Way
- Lot 2 Morelock Rd
- 0 Morelock Rd N
- 4091 White Wood Cir
- 4027 White Wood Cir
- 288 Fuller Estate Cir
- 4907 Barton Springs Dr
- 4458 Brockland Dr
- 1575 Thompson Creek Rd
- 0 Thompson Creek Rd
- 3736 Halifax Cir
- 3744 Halifax Cir
- 3748 Halifax Cir
- 3732 Halifax Cir
- 3739 Halifax Cir
- 3743 Halifax Cir
- 3735 Halifax Cir
- 3747 Halifax Cir
- 3728 Halifax Cir
- 3754 Halifax Cir
- 3754 Halifax Cir
- 3631 Mike Dr
- 3755 Halifax Cir
- 3722 Halifax Cir
- 3758 Halifax Cir
- 3720 E Morris Blvd
- 3637 Mike Dr
- 3767 Halifax Cir
- 3643 Mike Dr
- 3721 Halifax Cir