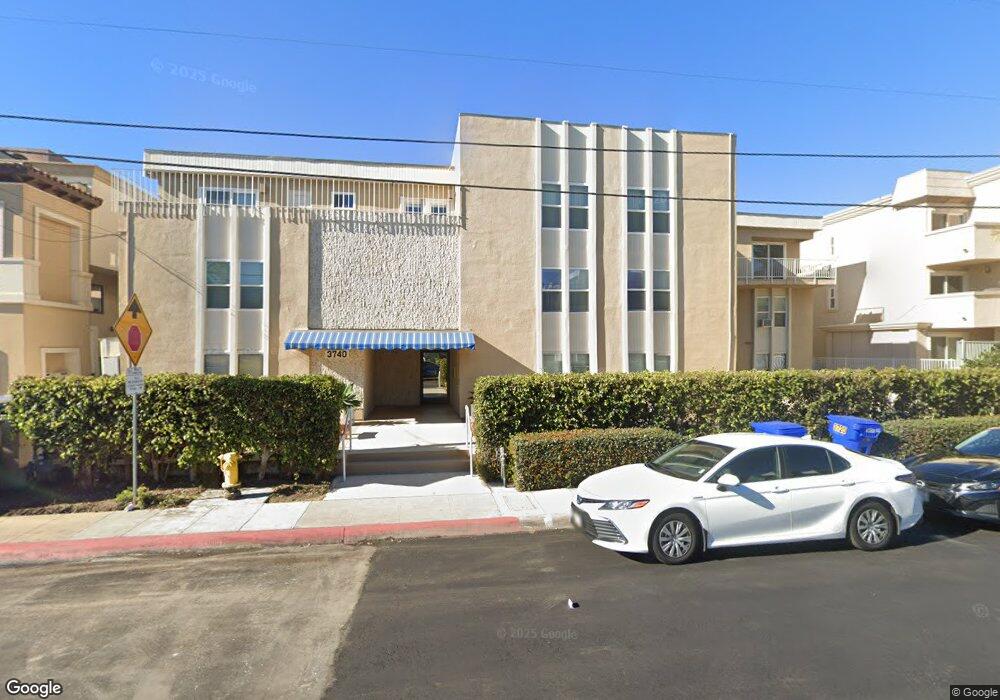
3740 Riviera Dr Unit E San Diego, CA 92109
Pacific Beach NeighborhoodEstimated Value: $876,000 - $1,093,000
2
Beds
2
Baths
894
Sq Ft
$1,083/Sq Ft
Est. Value
About This Home
This home is located at 3740 Riviera Dr Unit E, San Diego, CA 92109 and is currently estimated at $968,496, approximately $1,083 per square foot. 3740 Riviera Dr Unit E is a home located in San Diego County with nearby schools including Crown Point Junior Music Academy, Pacific Beach Middle, and Mission Bay High School.
Ownership History
Date
Name
Owned For
Owner Type
Purchase Details
Closed on
Nov 25, 2014
Sold by
Thompson Rochelle B
Bought by
Thompson Rochelle B and Rochelle B Thompson Trust
Current Estimated Value
Home Financials for this Owner
Home Financials are based on the most recent Mortgage that was taken out on this home.
Original Mortgage
$200,000
Outstanding Balance
$112,048
Interest Rate
3.95%
Mortgage Type
New Conventional
Estimated Equity
$856,448
Purchase Details
Closed on
May 21, 1998
Sold by
Thompson Roger D and Thompson Rochelle
Bought by
Thompson Rochelle B and Rochelle B Thompson Trust
Purchase Details
Closed on
Oct 2, 1997
Sold by
Lancaster George R and Lancaster Judith A
Bought by
Thompson Roger D and Thompson Rochelle
Home Financials for this Owner
Home Financials are based on the most recent Mortgage that was taken out on this home.
Original Mortgage
$177,750
Interest Rate
7.33%
Create a Home Valuation Report for This Property
The Home Valuation Report is an in-depth analysis detailing your home's value as well as a comparison with similar homes in the area
Home Values in the Area
Average Home Value in this Area
Purchase History
| Date | Buyer | Sale Price | Title Company |
|---|---|---|---|
| Thompson Rochelle B | -- | Tsi Title | |
| Thompson Rochelle B | -- | Tsi Title | |
| Thompson Rochelle B | -- | -- | |
| Thompson Roger D | $197,500 | First American Title |
Source: Public Records
Mortgage History
| Date | Status | Borrower | Loan Amount |
|---|---|---|---|
| Open | Thompson Rochelle B | $200,000 | |
| Closed | Thompson Rochelle B | $200,000 | |
| Previous Owner | Thompson Roger D | $177,750 |
Source: Public Records
Tax History Compared to Growth
Tax History
| Year | Tax Paid | Tax Assessment Tax Assessment Total Assessment is a certain percentage of the fair market value that is determined by local assessors to be the total taxable value of land and additions on the property. | Land | Improvement |
|---|---|---|---|---|
| 2025 | $3,819 | $314,536 | $163,729 | $150,807 |
| 2024 | $3,819 | $308,369 | $160,519 | $147,850 |
| 2023 | $3,735 | $302,323 | $157,372 | $144,951 |
| 2022 | $3,636 | $296,396 | $154,287 | $142,109 |
| 2021 | $3,611 | $290,585 | $151,262 | $139,323 |
| 2020 | $3,567 | $287,606 | $149,711 | $137,895 |
| 2019 | $3,504 | $281,968 | $146,776 | $135,192 |
| 2018 | $3,277 | $276,441 | $143,899 | $132,542 |
| 2017 | $3,200 | $271,022 | $141,078 | $129,944 |
| 2016 | $3,148 | $265,709 | $138,312 | $127,397 |
| 2015 | $3,102 | $261,719 | $136,235 | $125,484 |
| 2014 | $3,054 | $256,593 | $133,567 | $123,026 |
Source: Public Records
Map
Nearby Homes
- 3701 Riviera Dr Unit 4
- 3828 Riviera Dr Unit 2B
- 3705 Haines St
- 3850 Riviera Dr Unit 3B
- 3736 Promontory St
- 3843 Riviera Dr Unit 1
- 3920 Riviera Dr Unit A
- 3986 Riviera Dr
- 3943 Ingraham St
- 1703 La Playa Ave Unit B
- 4016 Gresham St Unit C2
- 4037 Haines St
- 3446 Buena Vista St
- 4071 Riviera Dr
- 4073 Riviera Dr
- 4070 Riviera Dr Unit 6
- 1323 Pacific Beach Dr Unit F
- 3955 Shasta St
- 4007 Everts St Unit 3G
- 4007 Everts St Unit 4H
- 3740 Riviera Dr Unit K
- 3740 Riviera Dr Unit L
- 3740 Riviera Dr Unit K
- 3740 Riviera Dr Unit J
- 3740 Riviera Dr Unit I
- 3740 Riviera Dr Unit H
- 3740 Riviera Dr Unit G
- 3740 Riviera Dr Unit F
- 3740 Riviera Dr Unit D
- 3740 Riviera Dr Unit C
- 3740 Riviera Dr Unit A
- 3740 Riviera Dr Unit N
- 3740 Riviera Dr Unit M
- 3726 Riviera Dr Unit 1
- 3726 Riviera Dr Unit 2
- 3726 Riviera Dr Unit E
- 3750 Riviera Dr Unit 8
- 3750 Riviera Dr Unit 9
- 3750 Riviera Dr Unit 7
- 3750 Riviera Dr Unit 6