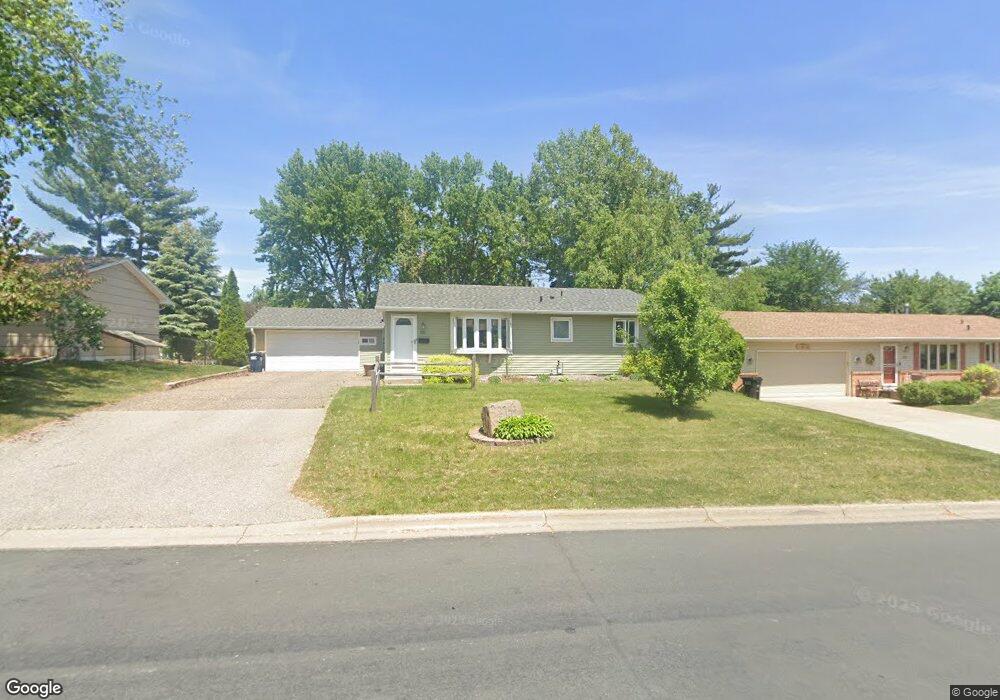
3741 75th St E Inver Grove Heights, MN 55076
Estimated Value: $341,000 - $365,000
4
Beds
2
Baths
1,824
Sq Ft
$193/Sq Ft
Est. Value
About This Home
This home is located at 3741 75th St E, Inver Grove Heights, MN 55076 and is currently estimated at $352,600, approximately $193 per square foot. 3741 75th St E is a home located in Dakota County with nearby schools including Hilltop Elementary School, Inver Grove Heights Middle School, and Simley Senior High School.
Ownership History
Date
Name
Owned For
Owner Type
Purchase Details
Closed on
Oct 16, 2020
Sold by
Haley Kaylyn J and Haley Brandon D
Bought by
Mcguire Jeffrey D
Current Estimated Value
Home Financials for this Owner
Home Financials are based on the most recent Mortgage that was taken out on this home.
Original Mortgage
$270,450
Interest Rate
2.8%
Mortgage Type
New Conventional
Purchase Details
Closed on
Apr 28, 2015
Sold by
Meister Timothy and Meister Michelle
Bought by
Haley Brandon D and Haley Kaylyn J
Home Financials for this Owner
Home Financials are based on the most recent Mortgage that was taken out on this home.
Original Mortgage
$196,278
Interest Rate
3.87%
Mortgage Type
FHA
Purchase Details
Closed on
Dec 15, 2010
Sold by
Loewen Jared L
Bought by
Meister Timothy and Meister Michelle
Purchase Details
Closed on
May 28, 2004
Sold by
Carlson Duane L and Carlson Jennifer R
Bought by
Loewen Jared Lloyd
Create a Home Valuation Report for This Property
The Home Valuation Report is an in-depth analysis detailing your home's value as well as a comparison with similar homes in the area
Home Values in the Area
Average Home Value in this Area
Purchase History
| Date | Buyer | Sale Price | Title Company |
|---|---|---|---|
| Mcguire Jeffrey D | $300,500 | Burnet Title | |
| Haley Brandon D | $199,900 | Bankers Title | |
| Meister Timothy | $199,900 | -- | |
| Meister Timothy | $199,900 | -- | |
| Loewen Jared Lloyd | $196,000 | -- | |
| Mcguire Jeffrey Jeffrey | $300,500 | -- |
Source: Public Records
Mortgage History
| Date | Status | Borrower | Loan Amount |
|---|---|---|---|
| Previous Owner | Mcguire Jeffrey D | $270,450 | |
| Previous Owner | Haley Brandon D | $196,278 | |
| Closed | Mcguire Jeffrey Jeffrey | $270,450 |
Source: Public Records
Tax History Compared to Growth
Tax History
| Year | Tax Paid | Tax Assessment Tax Assessment Total Assessment is a certain percentage of the fair market value that is determined by local assessors to be the total taxable value of land and additions on the property. | Land | Improvement |
|---|---|---|---|---|
| 2023 | $2,932 | $293,300 | $72,500 | $220,800 |
| 2022 | $2,224 | $290,700 | $72,400 | $218,300 |
| 2021 | $2,202 | $215,300 | $63,000 | $152,300 |
| 2020 | $2,506 | $210,200 | $60,000 | $150,200 |
| 2019 | $2,478 | $205,900 | $57,100 | $148,800 |
| 2018 | $2,310 | $190,400 | $54,400 | $136,000 |
| 2017 | $2,161 | $174,900 | $51,800 | $123,100 |
| 2016 | $2,187 | $159,600 | $49,400 | $110,200 |
| 2015 | $2,710 | $137,814 | $41,361 | $96,453 |
| 2014 | -- | $129,094 | $39,253 | $89,841 |
| 2013 | -- | $114,270 | $35,514 | $78,756 |
Source: Public Records
Map
Nearby Homes
- 3783 75th St E
- 3857 Conroy Trail
- 3861 Conroy Trail
- 7602 Connie Ln
- 7614 Connie Ln
- 3950 Upper 75th St E
- 3944 76th Way E
- 7628 Carla Path
- 7447 Cleadis Way
- 7551 Dawn Ave
- 7450 Clayton Ave
- 3591 78th St E
- 3530 77th St E
- 7381 Degrio Way
- 7944 Charles Way
- 15 Capital Dr
- 7996 Corey Path
- 4096 71st St E
- 3830 80th Ct E
- 7400 Cahill Ave
- 3741 3741 75th-Street-e
- 3755 75th St E
- 3725 75th St E
- 3734 74th St E
- 3748 74th St E
- 3711 75th St E
- 3769 75th St E
- 3718 3718 74th-Street-e
- 3718 74th St E
- 3764 74th St E
- 3760 75th St E
- 3680 75th St E
- 3704 74th St E
- 3780 74th St E
- 3670 3670 E 75th St E
- 3770 75th St E
- 3670 75th St E
- 3747 Conroy Trail
- 3683 75th St E
- 3797 75th St E