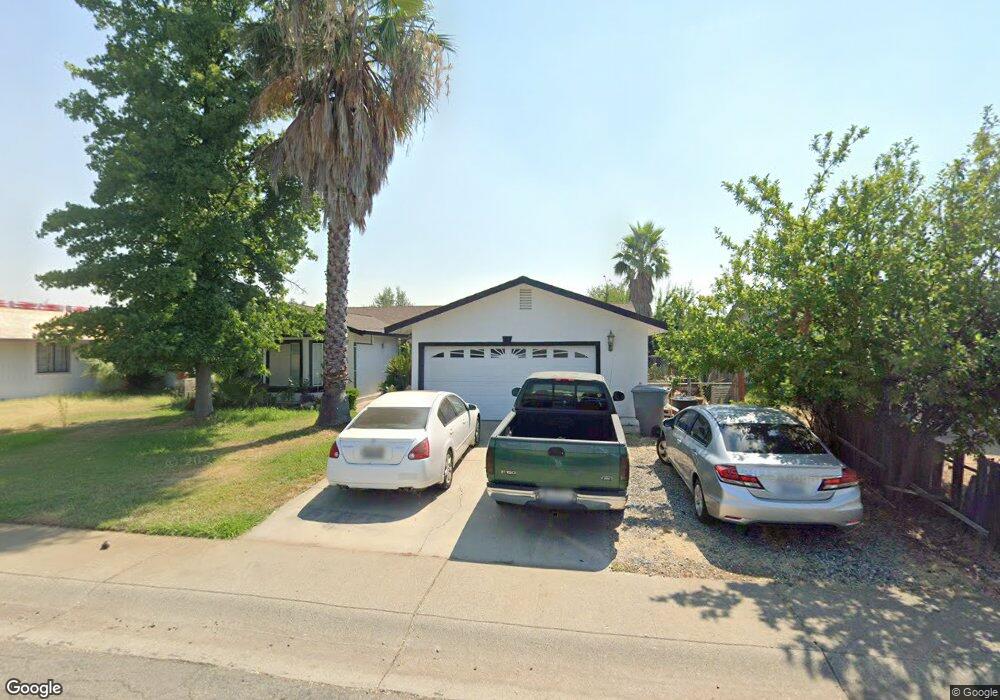
3741 Capricorn Way Redding, CA 96002
Starview NeighborhoodEstimated Value: $365,000 - $418,000
4
Beds
2
Baths
1,750
Sq Ft
$220/Sq Ft
Est. Value
About This Home
This home is located at 3741 Capricorn Way, Redding, CA 96002 and is currently estimated at $385,662, approximately $220 per square foot. 3741 Capricorn Way is a home located in Shasta County with nearby schools including Alta Mesa Elementary School, Parsons Junior High School, and Enterprise High School.
Ownership History
Date
Name
Owned For
Owner Type
Purchase Details
Closed on
Jan 13, 2022
Sold by
Ceja and Elsa
Bought by
Ceja-Manzo Family 2022 Trust
Current Estimated Value
Purchase Details
Closed on
Sep 20, 2002
Sold by
Baxman James A and Baxman Jennifer K
Bought by
Ceja Jose and Manzo Elsa
Home Financials for this Owner
Home Financials are based on the most recent Mortgage that was taken out on this home.
Original Mortgage
$112,000
Interest Rate
6.16%
Purchase Details
Closed on
Aug 2, 2000
Sold by
Trust Andresen Robt C & Margaret S Family and Andresen Robert C
Bought by
Baxman James A and Baxman Jennifer K
Home Financials for this Owner
Home Financials are based on the most recent Mortgage that was taken out on this home.
Original Mortgage
$101,796
Interest Rate
8.15%
Mortgage Type
VA
Create a Home Valuation Report for This Property
The Home Valuation Report is an in-depth analysis detailing your home's value as well as a comparison with similar homes in the area
Home Values in the Area
Average Home Value in this Area
Purchase History
| Date | Buyer | Sale Price | Title Company |
|---|---|---|---|
| Ceja-Manzo Family 2022 Trust | -- | None Listed On Document | |
| Ceja Jose | $140,000 | Placer Title Company | |
| Baxman James A | $100,000 | First American Title Co |
Source: Public Records
Mortgage History
| Date | Status | Borrower | Loan Amount |
|---|---|---|---|
| Previous Owner | Ceja Jose | $112,000 | |
| Previous Owner | Baxman James A | $101,796 |
Source: Public Records
Tax History
| Year | Tax Paid | Tax Assessment Tax Assessment Total Assessment is a certain percentage of the fair market value that is determined by local assessors to be the total taxable value of land and additions on the property. | Land | Improvement |
|---|---|---|---|---|
| 2025 | $2,139 | $202,743 | $50,680 | $152,063 |
| 2024 | $2,108 | $198,769 | $49,687 | $149,082 |
| 2023 | $2,108 | $194,872 | $48,713 | $146,159 |
| 2022 | $2,047 | $191,052 | $47,758 | $143,294 |
| 2021 | $1,975 | $187,307 | $46,822 | $140,485 |
| 2020 | $1,966 | $185,387 | $46,342 | $139,045 |
| 2019 | $1,949 | $181,753 | $45,434 | $136,319 |
| 2018 | $1,925 | $178,191 | $44,544 | $133,647 |
| 2017 | $1,957 | $174,698 | $43,671 | $131,027 |
| 2016 | $1,829 | $171,273 | $42,815 | $128,458 |
| 2015 | $1,813 | $168,701 | $42,172 | $126,529 |
| 2014 | $1,799 | $165,397 | $41,346 | $124,051 |
Source: Public Records
Map
Nearby Homes
- 3733 Capricorn Way
- 3688 Polaris Way
- 3512 Capricorn Way
- 2427 Castlewood Dr
- 2498 Saturn Skyway
- 2332 Venus Way
- 3792 Thomason Trail
- 2875 Eastbrook Dr
- 2354 Suzette Ave
- 2704 Western Oak Dr
- 3183 Agassi Ln
- 2068 Solar Way
- 0 Shasta View Unit 25-1945
- 3361 Alta Mesa Dr
- 3685 Wimbledon Dr
- 3030 Clear Water Ct
- 3385 Wimbledon Dr
- 2366 Templeton Dr
- 3341 Timbercreek Dr
- 3425 Silverwood St
- 3759 Capricorn Way
- 3765 Capricorn Way
- 3715 Capricorn Way Unit 1
- 3715 Capricorn Way
- 2573 Capella St
- 2578 Capella St
- 3781 Capricorn Way
- 3707 Capricorn Way
- 2561 Capella St
- 2557 Capella St
- 2590 Celestial St
- 2566 Capella St
- 2577 Venus Way
- 3811 Capricorn Way
- 2574 Celestial St
- 2563 Venus Way
- 2549 Capella St
- 2554 Capella St
- 3699 Capricorn Way
- 2562 Celestial St Unit 1
Your Personal Tour Guide
Ask me questions while you tour the home.