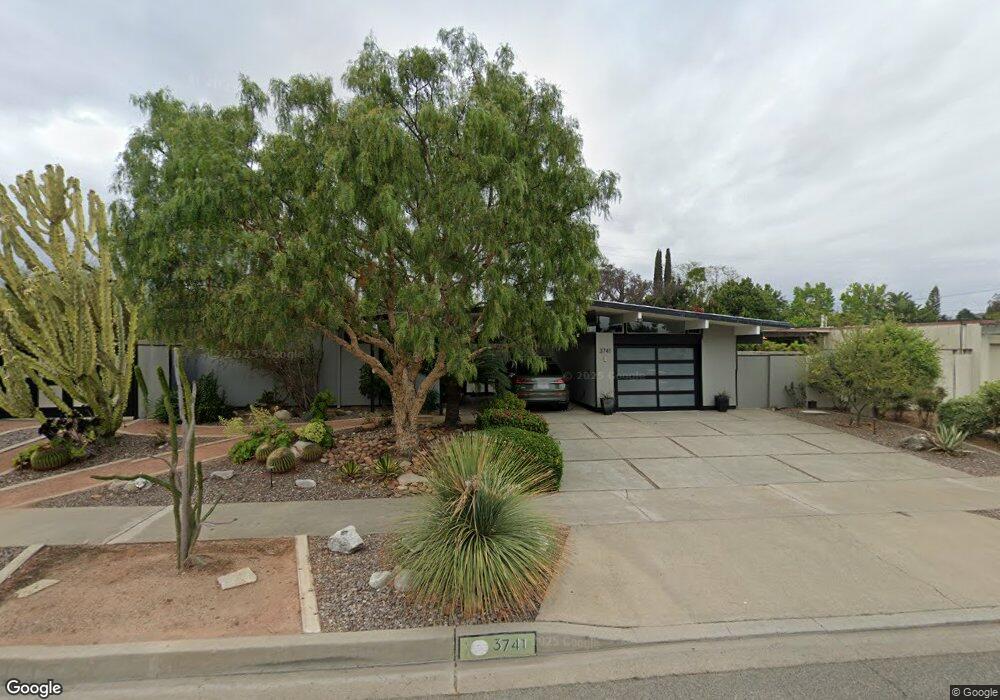
3741 E Kirkwood Ave Orange, CA 92869
Estimated Value: $1,326,000 - $1,536,000
4
Beds
2
Baths
1,973
Sq Ft
$722/Sq Ft
Est. Value
About This Home
This home is located at 3741 E Kirkwood Ave, Orange, CA 92869 and is currently estimated at $1,423,718, approximately $721 per square foot. 3741 E Kirkwood Ave is a home located in Orange County with nearby schools including Jordan Academy of Language & Computer Science, El Modena High School, and Spirit Christian Academy.
Ownership History
Date
Name
Owned For
Owner Type
Purchase Details
Closed on
Oct 22, 2021
Sold by
Miller Stanley Fitzer and Miller Paula Ann
Bought by
Miller Stanley Fitzer and Miller Paula Ann
Current Estimated Value
Home Financials for this Owner
Home Financials are based on the most recent Mortgage that was taken out on this home.
Original Mortgage
$5,520,000
Outstanding Balance
$5,033,725
Interest Rate
2.8%
Mortgage Type
Credit Line Revolving
Estimated Equity
-$3,610,007
Purchase Details
Closed on
Jul 12, 2018
Sold by
Miller Stanley F and Miller Paula Ann
Bought by
Miller Stanley F and Miller Paula Ann
Purchase Details
Closed on
Nov 10, 1997
Sold by
Body Bruce F and Body Kristina M
Bought by
Miller Stanley F and Miller Paula Ann
Home Financials for this Owner
Home Financials are based on the most recent Mortgage that was taken out on this home.
Original Mortgage
$214,200
Interest Rate
7.19%
Create a Home Valuation Report for This Property
The Home Valuation Report is an in-depth analysis detailing your home's value as well as a comparison with similar homes in the area
Home Values in the Area
Average Home Value in this Area
Purchase History
| Date | Buyer | Sale Price | Title Company |
|---|---|---|---|
| Miller Stanley Fitzer | -- | Placer Title Company | |
| Miller Stanley F | -- | None Available | |
| Miller Stanley F | $255,000 | Gateway Title |
Source: Public Records
Mortgage History
| Date | Status | Borrower | Loan Amount |
|---|---|---|---|
| Open | Miller Stanley Fitzer | $5,520,000 | |
| Closed | Miller Stanley F | $214,200 |
Source: Public Records
Tax History
| Year | Tax Paid | Tax Assessment Tax Assessment Total Assessment is a certain percentage of the fair market value that is determined by local assessors to be the total taxable value of land and additions on the property. | Land | Improvement |
|---|---|---|---|---|
| 2025 | $4,539 | $407,166 | $255,396 | $151,770 |
| 2024 | $4,539 | $399,183 | $250,388 | $148,795 |
| 2023 | $4,435 | $391,356 | $245,478 | $145,878 |
| 2022 | $4,347 | $383,683 | $240,665 | $143,018 |
| 2021 | $4,226 | $376,160 | $235,946 | $140,214 |
| 2020 | $4,186 | $372,303 | $233,526 | $138,777 |
| 2019 | $4,134 | $365,003 | $228,947 | $136,056 |
| 2018 | $4,070 | $357,847 | $224,458 | $133,389 |
| 2017 | $3,904 | $350,831 | $220,057 | $130,774 |
| 2016 | $3,828 | $343,952 | $215,742 | $128,210 |
| 2015 | $3,771 | $338,786 | $212,501 | $126,285 |
| 2014 | $3,689 | $332,150 | $208,338 | $123,812 |
Source: Public Records
Map
Nearby Homes
- 732 S Woodland St
- 17922 Romelle Ave
- 4346 E Casselle Ave
- 18806 Winnwood Ln
- 3836 E Ruth Place
- 3030 E Elgin Place
- 18831 Winnwood Ln
- 4334 E Ruth Place
- 449 S Wellington Rd
- 18804 Winnwood Ln
- 338 S James St
- 13032 Stanton
- 411 S Hewes St
- 18945 Fowler Ave
- 235 S Dunas St
- 12852 Fairhaven Extension
- 4223 E Marmon Ave
- 12284 Circula Panorama
- 4225 E Court Ave
- 244 S Violet Ln
- 3811 E Kirkwood Ave
- 795 S Woodland St
- 787 S Woodland St
- 3744 E Fernwood Ave
- 777 S Woodland St
- 3802 E Fernwood Ave
- 3823 E Kirkwood Ave
- 3800 E Kirkwood Ave
- 3812 E Kirkwood Ave
- 3740 E Kirkwood Ave
- 3810 E Fernwood Ave
- 3730 E Kirkwood Ave
- 3826 E Kirkwood Ave
- 3833 E Kirkwood Ave
- 788 S Woodland St
- 847 S Woodland St
- 796 S Woodland St
- 848 S Cedarwood St
- 3741 E Fernwood Ave
- 780 S Woodland St
Your Personal Tour Guide
Ask me questions while you tour the home.