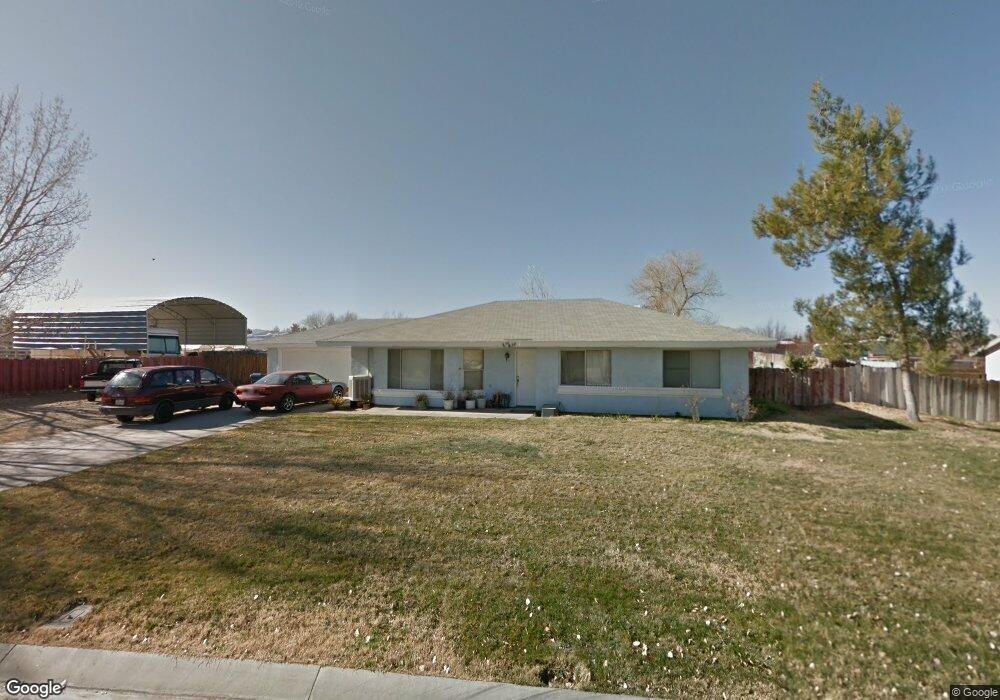
37415 97th St E Littlerock, CA 93543
Estimated Value: $480,215 - $582,000
3
Beds
2
Baths
1,664
Sq Ft
$315/Sq Ft
Est. Value
About This Home
This home is located at 37415 97th St E, Littlerock, CA 93543 and is currently estimated at $524,554, approximately $315 per square foot. 37415 97th St E is a home located in Los Angeles County with nearby schools including Antelope Elementary School, Keppel Academy, and Littlerock High School.
Ownership History
Date
Name
Owned For
Owner Type
Purchase Details
Closed on
Nov 17, 1994
Sold by
Bank Of America
Bought by
Resolution Trust Corp and Western Fsb
Current Estimated Value
Home Financials for this Owner
Home Financials are based on the most recent Mortgage that was taken out on this home.
Original Mortgage
$64,400
Interest Rate
8.91%
Purchase Details
Closed on
Nov 1, 1994
Sold by
Resolution Trust Corp
Bought by
Barragan Octavio Perez and Barragan Carmen Otilia
Home Financials for this Owner
Home Financials are based on the most recent Mortgage that was taken out on this home.
Original Mortgage
$64,400
Interest Rate
8.91%
Purchase Details
Closed on
Sep 28, 1994
Sold by
Gipson Ronald and Gipson Gwendolyn
Bought by
Bank Of America and Security Pacific National Bank
Home Financials for this Owner
Home Financials are based on the most recent Mortgage that was taken out on this home.
Original Mortgage
$64,400
Interest Rate
8.91%
Create a Home Valuation Report for This Property
The Home Valuation Report is an in-depth analysis detailing your home's value as well as a comparison with similar homes in the area
Home Values in the Area
Average Home Value in this Area
Purchase History
| Date | Buyer | Sale Price | Title Company |
|---|---|---|---|
| Resolution Trust Corp | -- | Fidelity National Title Ins | |
| Barragan Octavio Perez | -- | Fidelity National Title Ins | |
| Bank Of America | $85,000 | World Title Company |
Source: Public Records
Mortgage History
| Date | Status | Borrower | Loan Amount |
|---|---|---|---|
| Closed | Barragan Octavio Perez | $64,400 |
Source: Public Records
Tax History
| Year | Tax Paid | Tax Assessment Tax Assessment Total Assessment is a certain percentage of the fair market value that is determined by local assessors to be the total taxable value of land and additions on the property. | Land | Improvement |
|---|---|---|---|---|
| 2025 | $1,933 | $154,498 | $33,576 | $120,922 |
| 2024 | $1,933 | $151,469 | $32,918 | $118,551 |
| 2023 | $1,895 | $148,500 | $32,273 | $116,227 |
| 2022 | $1,863 | $145,590 | $31,641 | $113,949 |
| 2021 | $1,824 | $142,736 | $31,021 | $111,715 |
| 2019 | $1,772 | $138,503 | $30,101 | $108,402 |
| 2018 | $1,759 | $135,788 | $29,511 | $106,277 |
| 2016 | $1,645 | $130,517 | $28,366 | $102,151 |
| 2015 | $1,623 | $128,557 | $27,940 | $100,617 |
| 2014 | $1,627 | $126,040 | $27,393 | $98,647 |
Source: Public Records
Map
Nearby Homes
- 9701 East Ave S
- 9 East Ave S
- 147 E Avenue R 10
- 0 Cor Ave R8 100th Ste Unit 25005146
- 136 Th. Str& East Ave S
- 0 E Avenue R 10
- 9340 E Avenue r10
- 111 R12 E 12 St Unit (D
- 9860 East Ave S
- 37125 95th St E
- 37036 98th St E
- 9241 E Avenue r14
- 9249 E Avenue r10
- 9249 E East Ave R4
- 9249 E Avenue R 4
- 1000 100th St E
- 0 East Ave S
- 10117 E Avenue s2
- 9756 E Avenue s4
- 10256 E Avenue r12
- 37425 97th St E
- 37403 97th St E
- 37410 97th St E
- 37420 97th St E
- 37435 97th St E
- 37372 97th St E
- 37434 97th St E
- 9670 E Avenue r12
- 9662 E Avenue r12
- 37447 97th St E
- 9654 E Avenue r12
- 37362 97th St E
- 9640 E Avenue r12
- 37448 97th St E
- 37457 97th St E
- 9630 E Avenue r12
- 37374 96th St E
- 37352 97th St E
- 9628 E Avenue R 10
- 9618 E Avenue r12
Your Personal Tour Guide
Ask me questions while you tour the home.