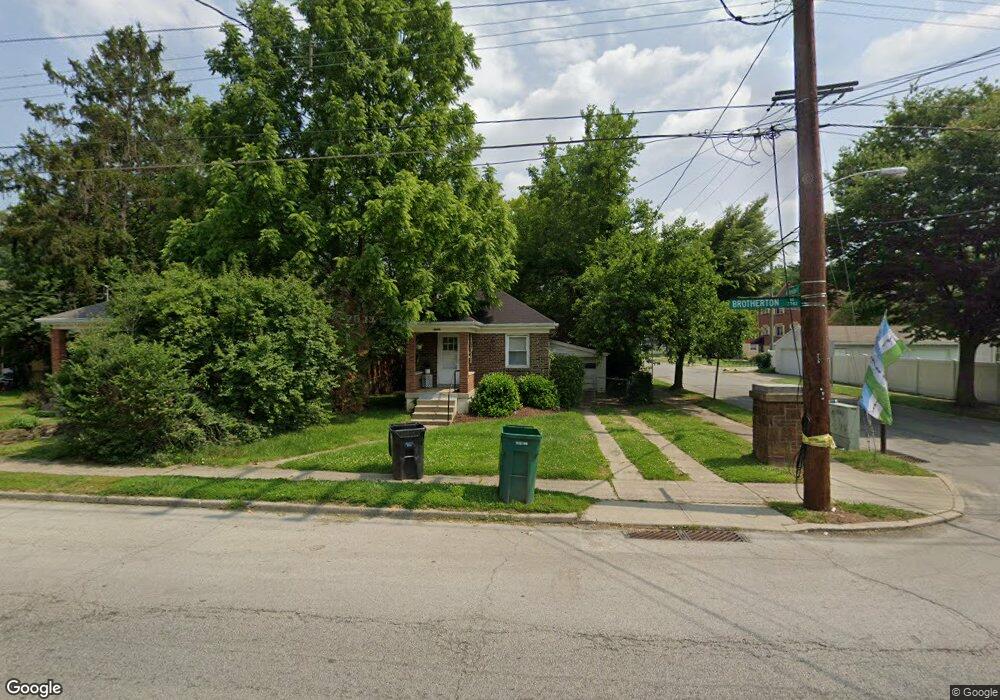
3742 Brotherton Rd Cincinnati, OH 45209
Oakley NeighborhoodEstimated Value: $180,000 - $232,100
1
Bed
1
Bath
595
Sq Ft
$352/Sq Ft
Est. Value
About This Home
This home is located at 3742 Brotherton Rd, Cincinnati, OH 45209 and is currently estimated at $209,275, approximately $351 per square foot. 3742 Brotherton Rd is a home located in Hamilton County with nearby schools including Clark Montessori High School, Shroder High School, and Withrow University High School.
Ownership History
Date
Name
Owned For
Owner Type
Purchase Details
Closed on
Feb 18, 2011
Sold by
Webb Maggie E and Webb Ted
Bought by
Matson Rachel
Current Estimated Value
Home Financials for this Owner
Home Financials are based on the most recent Mortgage that was taken out on this home.
Original Mortgage
$120,368
Outstanding Balance
$82,638
Interest Rate
4.85%
Mortgage Type
FHA
Estimated Equity
$126,637
Purchase Details
Closed on
Jun 17, 2005
Sold by
Clear River Properties Llc
Bought by
Hunterman Sarah
Home Financials for this Owner
Home Financials are based on the most recent Mortgage that was taken out on this home.
Original Mortgage
$61,600
Interest Rate
6.37%
Mortgage Type
Fannie Mae Freddie Mac
Purchase Details
Closed on
Mar 16, 2005
Sold by
Cohron James W and Bilyeu Cohron Suzann
Bought by
Clear River Properties Llc
Home Financials for this Owner
Home Financials are based on the most recent Mortgage that was taken out on this home.
Original Mortgage
$54,400
Interest Rate
4.99%
Mortgage Type
Fannie Mae Freddie Mac
Create a Home Valuation Report for This Property
The Home Valuation Report is an in-depth analysis detailing your home's value as well as a comparison with similar homes in the area
Home Values in the Area
Average Home Value in this Area
Purchase History
| Date | Buyer | Sale Price | Title Company |
|---|---|---|---|
| Matson Rachel | $123,500 | Chase Legal Title Llc | |
| Hunterman Sarah | $77,000 | Advanced Land Title Agency L | |
| Clear River Properties Llc | -- | None Available |
Source: Public Records
Mortgage History
| Date | Status | Borrower | Loan Amount |
|---|---|---|---|
| Open | Matson Rachel | $120,368 | |
| Previous Owner | Hunterman Sarah | $61,600 | |
| Previous Owner | Clear River Properties Llc | $54,400 |
Source: Public Records
Tax History Compared to Growth
Tax History
| Year | Tax Paid | Tax Assessment Tax Assessment Total Assessment is a certain percentage of the fair market value that is determined by local assessors to be the total taxable value of land and additions on the property. | Land | Improvement |
|---|---|---|---|---|
| 2024 | $3,847 | $60,050 | $38,574 | $21,476 |
| 2023 | $3,853 | $60,050 | $38,574 | $21,476 |
| 2022 | $3,180 | $44,458 | $18,505 | $25,953 |
| 2021 | $3,111 | $44,458 | $18,505 | $25,953 |
| 2020 | $3,120 | $44,458 | $18,505 | $25,953 |
| 2019 | $2,860 | $37,048 | $15,421 | $21,627 |
| 2018 | $2,862 | $37,048 | $15,421 | $21,627 |
| 2017 | $2,755 | $37,048 | $15,421 | $21,627 |
| 2016 | $1,773 | $23,100 | $10,752 | $12,348 |
| 2015 | $1,587 | $23,100 | $10,752 | $12,348 |
| 2014 | $1,596 | $23,100 | $10,752 | $12,348 |
| 2013 | $1,621 | $23,100 | $10,752 | $12,348 |
Source: Public Records
Map
Nearby Homes
- 3655 Brotherton Rd
- 3636 Brotherton Rd
- 3643 Brotherton Rd
- 4112 Paxton Woods Dr
- 4177 Club View Dr
- 3522 Brotherton Rd
- 4929 Charlemar Dr
- 3587 Harrow Ave
- 3412 Brotherton Rd
- 3410 Brotherton Rd
- 5044 W Eastwood Cir
- 4479 Butterfield Place
- 4480 Butterfield Place
- 4214 Marburg Ave
- 4496 Butterfield Place
- 3880 Marburg Ave
- 3259 Berwyn Place
- 3350 Everson Ave
- 3309 Bach Ave
- 4408 Erie Ave
- 3740 Brotherton Rd
- 3738 Brotherton Rd
- 3744 Brotherton Rd
- 4211 Allendorf Dr
- 3736 Brotherton Rd
- 3746 Brotherton Rd
- 3734 Brotherton Rd
- 3733 Brotherton Rd
- 3735 Brotherton Rd
- 3760 Brotherton Rd
- 3731 Brotherton Rd
- 3737 Brotherton Rd
- 3739 Brotherton Rd
- 3726 Brotherton Rd
- 3800 Brotherton Rd
- 3729 Brotherton Rd
- 3741 Brotherton Rd
- 3724 Brotherton Rd
- 3727 Brotherton Rd
- 3802 Brotherton Rd