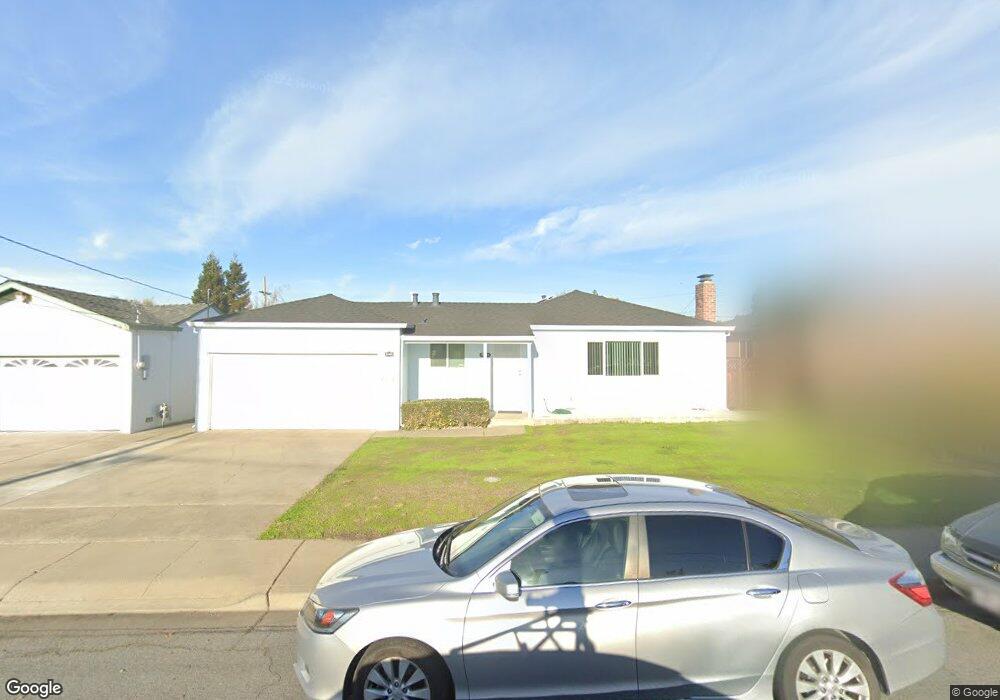
37424 Southwood Dr Fremont, CA 94536
Centerville District NeighborhoodEstimated Value: $1,133,000 - $1,270,000
3
Beds
2
Baths
1,119
Sq Ft
$1,088/Sq Ft
Est. Value
About This Home
This home is located at 37424 Southwood Dr, Fremont, CA 94536 and is currently estimated at $1,217,963, approximately $1,088 per square foot. 37424 Southwood Dr is a home located in Alameda County with nearby schools including Glenmoor Elementary School, Centerville Junior High School, and Washington High School.
Ownership History
Date
Name
Owned For
Owner Type
Purchase Details
Closed on
Apr 17, 2001
Sold by
Chin Felix M and Win Ma Thida
Bought by
Lin Daniel and Huang Ann
Current Estimated Value
Home Financials for this Owner
Home Financials are based on the most recent Mortgage that was taken out on this home.
Original Mortgage
$320,000
Outstanding Balance
$119,983
Interest Rate
7.25%
Estimated Equity
$1,097,980
Purchase Details
Closed on
Jan 10, 2001
Sold by
Fernandez Donald G and Fernandez Wyona E
Bought by
Chin Felix M and Win Ma Thida
Home Financials for this Owner
Home Financials are based on the most recent Mortgage that was taken out on this home.
Original Mortgage
$268,000
Interest Rate
7.12%
Purchase Details
Closed on
Dec 8, 2000
Sold by
Fernandez Donald G and Fernandez Wyona E
Bought by
Fernandez Donald G and Fernandez Wyona E
Home Financials for this Owner
Home Financials are based on the most recent Mortgage that was taken out on this home.
Original Mortgage
$268,000
Interest Rate
7.12%
Create a Home Valuation Report for This Property
The Home Valuation Report is an in-depth analysis detailing your home's value as well as a comparison with similar homes in the area
Home Values in the Area
Average Home Value in this Area
Purchase History
| Date | Buyer | Sale Price | Title Company |
|---|---|---|---|
| Lin Daniel | $415,000 | Old Republic Title Company | |
| Chin Felix M | $335,000 | Old Republic Title Company | |
| Fernandez Donald G | $350,000 | Old Republic Title Company |
Source: Public Records
Mortgage History
| Date | Status | Borrower | Loan Amount |
|---|---|---|---|
| Open | Lin Daniel | $320,000 | |
| Previous Owner | Chin Felix M | $268,000 | |
| Closed | Chin Felix M | $33,500 |
Source: Public Records
Tax History Compared to Growth
Tax History
| Year | Tax Paid | Tax Assessment Tax Assessment Total Assessment is a certain percentage of the fair market value that is determined by local assessors to be the total taxable value of land and additions on the property. | Land | Improvement |
|---|---|---|---|---|
| 2025 | $7,686 | $618,292 | $187,587 | $437,705 |
| 2024 | $7,686 | $606,033 | $183,910 | $429,123 |
| 2023 | $7,474 | $601,014 | $180,304 | $420,710 |
| 2022 | $7,368 | $582,233 | $176,770 | $412,463 |
| 2021 | $7,188 | $570,680 | $173,304 | $404,376 |
| 2020 | $7,180 | $571,757 | $171,527 | $400,230 |
| 2019 | $7,099 | $560,548 | $168,164 | $392,384 |
| 2018 | $6,958 | $549,558 | $164,867 | $384,691 |
| 2017 | $6,784 | $538,785 | $161,635 | $377,150 |
| 2016 | $6,663 | $528,224 | $158,467 | $369,757 |
| 2015 | $6,570 | $520,293 | $156,088 | $364,205 |
| 2014 | $6,453 | $510,104 | $153,031 | $357,073 |
Source: Public Records
Map
Nearby Homes
- 4737 Deadwood Dr
- 37721 Madera Ct
- 37114 Dondero Way
- 4637 Rothbury Common
- 37792 Colfax Ct
- 4586 Norris Rd
- 37001 Contra Costa Ave
- 37987 Alta Dr
- 5268 Keeler Ct
- 5169 Lawler Ave
- 4632 Balboa Way
- 36720 Charles St
- 36686 Charles St
- 37659 Granville Dr
- 36521 Cabrillo Dr
- 38324 Blacow Rd
- 5113 Dupont Ave
- 4715 Eggers Dr
- 36347 Magellan Dr
- 5669 Civic Terrace Ave
- 37432 Southwood Dr
- 37416 Southwood Dr
- 37425 Briarwood Dr
- 37433 Briarwood Dr
- 37417 Briarwood Dr
- 37440 Southwood Dr
- 4838 Deadwood Dr
- 37421 Southwood Dr
- 37441 Briarwood Dr
- 4820 Deadwood Dr
- 37429 Southwood Dr
- 37413 Southwood Dr
- 37437 Southwood Dr
- 37405 Southwood Dr
- 37449 Briarwood Dr
- 37445 Southwood Dr
- 37422 Briarwood Dr
- 4920 Roselle Common
- 4924 Roselle Common
- 37430 Briarwood Dr