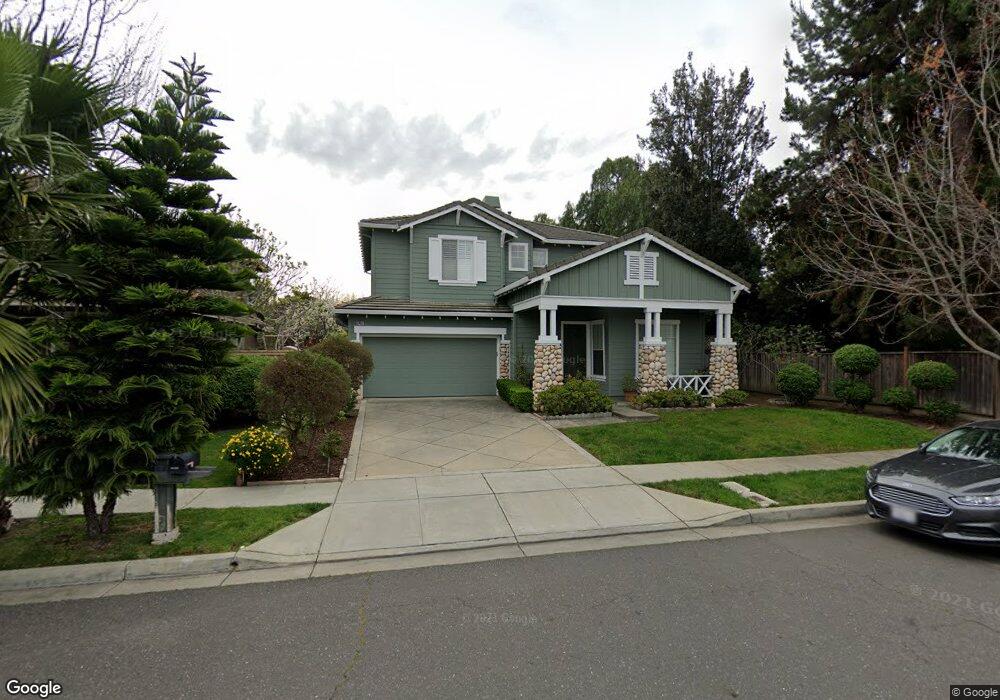
37437 Gillett Rd Fremont, CA 94536
Centerville District NeighborhoodEstimated Value: $1,756,000 - $1,813,387
3
Beds
3
Baths
2,132
Sq Ft
$842/Sq Ft
Est. Value
About This Home
This home is located at 37437 Gillett Rd, Fremont, CA 94536 and is currently estimated at $1,794,097, approximately $841 per square foot. 37437 Gillett Rd is a home located in Alameda County with nearby schools including Glenmoor Elementary School, Centerville Junior High School, and Washington High School.
Ownership History
Date
Name
Owned For
Owner Type
Purchase Details
Closed on
Jan 21, 2008
Sold by
Santiago Florida M
Bought by
Santiago Florida M and Santiago Trust
Current Estimated Value
Purchase Details
Closed on
Nov 5, 1999
Sold by
Kaufman & Broad South Bay Inc
Bought by
Santiago Florida M
Home Financials for this Owner
Home Financials are based on the most recent Mortgage that was taken out on this home.
Original Mortgage
$306,450
Outstanding Balance
$63,606
Interest Rate
3.45%
Estimated Equity
$1,730,491
Create a Home Valuation Report for This Property
The Home Valuation Report is an in-depth analysis detailing your home's value as well as a comparison with similar homes in the area
Home Values in the Area
Average Home Value in this Area
Purchase History
| Date | Buyer | Sale Price | Title Company |
|---|---|---|---|
| Santiago Florida M | -- | None Available | |
| Santiago Florida M | $383,500 | First American Title Guarant |
Source: Public Records
Mortgage History
| Date | Status | Borrower | Loan Amount |
|---|---|---|---|
| Open | Santiago Florida M | $306,450 |
Source: Public Records
Tax History Compared to Growth
Tax History
| Year | Tax Paid | Tax Assessment Tax Assessment Total Assessment is a certain percentage of the fair market value that is determined by local assessors to be the total taxable value of land and additions on the property. | Land | Improvement |
|---|---|---|---|---|
| 2025 | $7,279 | $581,628 | $176,588 | $412,040 |
| 2024 | $7,279 | $570,088 | $173,126 | $403,962 |
| 2023 | $7,076 | $565,774 | $169,732 | $396,042 |
| 2022 | $6,974 | $547,683 | $166,405 | $388,278 |
| 2021 | $6,805 | $536,810 | $163,143 | $380,667 |
| 2020 | $6,791 | $538,237 | $161,471 | $376,766 |
| 2019 | $6,714 | $527,685 | $158,305 | $369,380 |
| 2018 | $6,581 | $517,340 | $155,202 | $362,138 |
| 2017 | $6,416 | $507,198 | $152,159 | $355,039 |
| 2016 | $6,301 | $497,255 | $149,176 | $348,079 |
| 2015 | $6,212 | $489,787 | $146,936 | $342,851 |
| 2014 | $6,101 | $480,193 | $144,058 | $336,135 |
Source: Public Records
Map
Nearby Homes
- Plan 1725 at Veranda
- Plan 1670 at Veranda
- Plan 1657 at Veranda
- Plan 1629 at Veranda
- Plan 1455 at Veranda
- Plan 1394 at Veranda
- Plan 1378 at Veranda
- Plan 1165 at Veranda
- 37621 Glenmoor Dr
- 37502 Zephyr Terrace
- 37826 Glenmoor Dr
- 3810 Burton Common
- 38265 Corrigan Ct
- 3507 Buttonwood Terrace Unit 203
- 4586 Norris Rd
- 37001 Contra Costa Ave
- 37637 Canterbury St
- 3443 Pepperwood Terrace Unit 301
- 4544 Thornton Ave
- 3663 Oakwood Terrace Unit 211
- 37441 Gillett Rd
- 37487 Joseph St
- 4231 Central Ave
- 37445 Gillett Rd
- 37433 Gillett Rd
- 37428 Gillett Rd
- 4255 Central Ave Unit 3
- 4255 Central Ave Unit 1
- 4255 Central Ave Unit 2
- 4255 Central Ave
- 4255 Central Ave Unit 4
- 37432 Gillett Rd
- 4211 Central Ave
- 37436 Gillett Rd
- 37429 Gillett Rd
- 37424 Gillett Rd
- 37425 Gillett Rd
- 37447 Joseph St
- 4211 Westminster Cir
- 4265 Central Ave