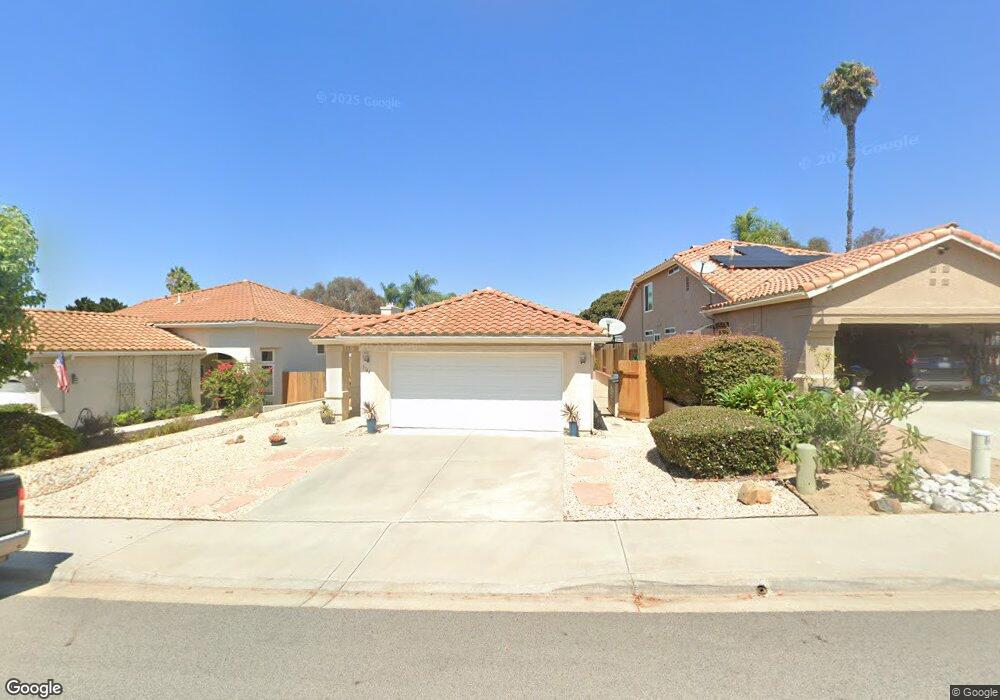
3744 Via Cabrillo Oceanside, CA 92056
Ocean Hills NeighborhoodEstimated Value: $805,569 - $916,000
2
Beds
2
Baths
1,208
Sq Ft
$707/Sq Ft
Est. Value
About This Home
This home is located at 3744 Via Cabrillo, Oceanside, CA 92056 and is currently estimated at $853,642, approximately $706 per square foot. 3744 Via Cabrillo is a home located in San Diego County with nearby schools including Lake Elementary School, Madison Middle School, and Rancho Buena Vista High School.
Ownership History
Date
Name
Owned For
Owner Type
Purchase Details
Closed on
Jan 14, 2009
Sold by
Pullman Daniel and Perez Mary
Bought by
Chadwick Douglas Austin and Chadwick Rebecca M
Current Estimated Value
Home Financials for this Owner
Home Financials are based on the most recent Mortgage that was taken out on this home.
Original Mortgage
$276,892
Interest Rate
5.08%
Mortgage Type
FHA
Purchase Details
Closed on
Jul 13, 2005
Sold by
Wiersma Gerritt and Wiersma Hendrika E
Bought by
Pullman Daniel and Perez Mary
Home Financials for this Owner
Home Financials are based on the most recent Mortgage that was taken out on this home.
Original Mortgage
$386,400
Interest Rate
5.99%
Mortgage Type
Fannie Mae Freddie Mac
Purchase Details
Closed on
Jul 17, 2003
Sold by
Wiersma Gerrit and Wiersma Hendrika E
Bought by
Wiersma Gerrit and Wiersma Hendrika E
Purchase Details
Closed on
Nov 18, 1988
Create a Home Valuation Report for This Property
The Home Valuation Report is an in-depth analysis detailing your home's value as well as a comparison with similar homes in the area
Home Values in the Area
Average Home Value in this Area
Purchase History
| Date | Buyer | Sale Price | Title Company |
|---|---|---|---|
| Chadwick Douglas Austin | $282,000 | Fidelity National Title Co | |
| Pullman Daniel | $483,000 | First American Title | |
| Wiersma Gerrit | -- | -- | |
| -- | $133,000 | -- |
Source: Public Records
Mortgage History
| Date | Status | Borrower | Loan Amount |
|---|---|---|---|
| Previous Owner | Chadwick Douglas Austin | $276,892 | |
| Previous Owner | Pullman Daniel | $386,400 |
Source: Public Records
Tax History
| Year | Tax Paid | Tax Assessment Tax Assessment Total Assessment is a certain percentage of the fair market value that is determined by local assessors to be the total taxable value of land and additions on the property. | Land | Improvement |
|---|---|---|---|---|
| 2025 | $3,842 | $363,131 | $231,788 | $131,343 |
| 2024 | $3,842 | $356,012 | $227,244 | $128,768 |
| 2023 | $3,749 | $349,033 | $222,789 | $126,244 |
| 2022 | $3,737 | $342,190 | $218,421 | $123,769 |
| 2021 | $3,653 | $335,482 | $214,139 | $121,343 |
| 2020 | $3,640 | $332,043 | $211,944 | $120,099 |
| 2019 | $3,585 | $325,534 | $207,789 | $117,745 |
| 2018 | $3,407 | $319,152 | $203,715 | $115,437 |
| 2017 | $3,343 | $312,895 | $199,721 | $113,174 |
| 2016 | $3,262 | $306,760 | $195,805 | $110,955 |
| 2015 | $3,248 | $302,153 | $192,864 | $109,289 |
| 2014 | $3,167 | $296,236 | $189,087 | $107,149 |
Source: Public Records
Map
Nearby Homes
- 3732 Via Cabrillo
- 1831 Olympus Loop Dr
- 5162 Berryessa St
- 5155 Via Seville
- 3677 Via Bernardo
- 1715 Landing Dr
- 1983 Courage St
- 4706 Zamora Way
- 4920 Keos Way
- 2198 Redwood Crest
- 3643 Merced Dr
- 4528 Cordoba Way
- 1831 Monserrat Way
- 4710 Galicia Way
- 4912 Colusa Dr
- 4993 Lamia Way
- 4246 Lindos Way
- 1984 Casablanca Ct
- 1603 Laurelwood Way
- 1734 Countryside Dr
- 3748 Via Cabrillo
- 3740 Via Cabrillo
- 3752 Via Cabrillo
- 3736 Via Cabrillo
- 3756 Via Cabrillo
- 3760 Via Cabrillo
- 3745 Via Cabrillo
- 3749 Via Cabrillo
- 3741 Via Cabrillo
- 3753 Via Cabrillo
- 3737 Via Cabrillo
- 3728 Via Cabrillo
- 3757 Via Cabrillo
- 3733 Via Cabrillo
- 3764 Via Cabrillo
- 3761 Via Cabrillo
- 3729 Via Cabrillo
- 3724 Via Cabrillo
- 3763 Via Cabrillo
- 3735 Via Del Rancho
Your Personal Tour Guide
Ask me questions while you tour the home.