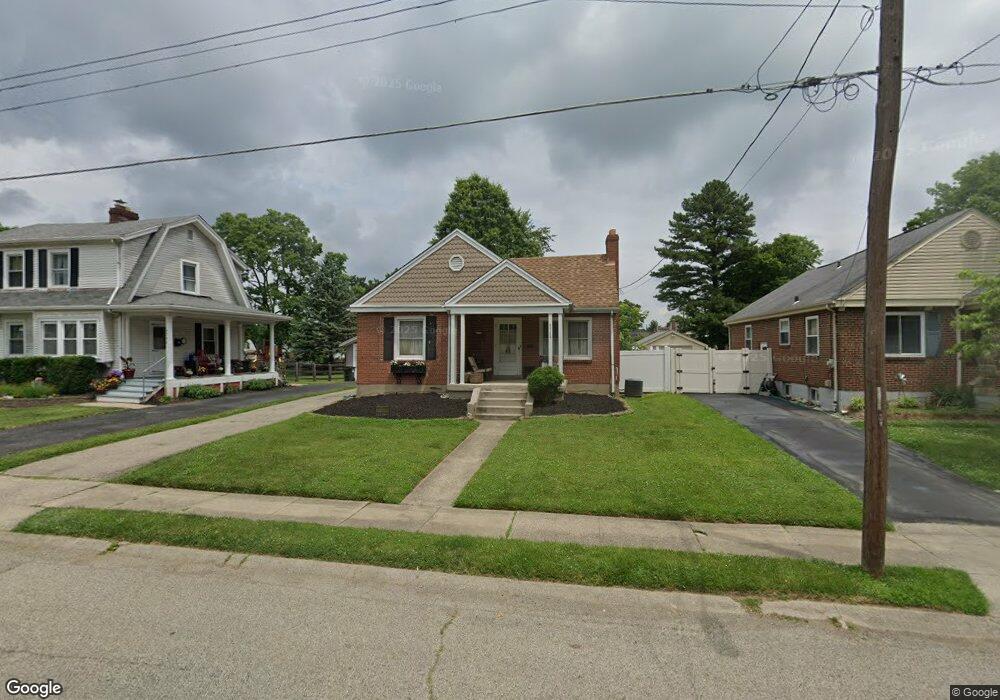
3746 N Berkley Cir Cincinnati, OH 45236
Estimated Value: $207,000 - $237,000
2
Beds
1
Bath
924
Sq Ft
$246/Sq Ft
Est. Value
About This Home
This home is located at 3746 N Berkley Cir, Cincinnati, OH 45236 and is currently estimated at $227,212, approximately $245 per square foot. 3746 N Berkley Cir is a home located in Hamilton County with nearby schools including Silverton Paideia Elementary School, Shroder High School, and Clark Montessori High School.
Ownership History
Date
Name
Owned For
Owner Type
Purchase Details
Closed on
Jul 15, 2024
Sold by
Benhase Richard
Bought by
Bonenfant Jennifer and Bonenfant Thomas
Current Estimated Value
Purchase Details
Closed on
Apr 30, 2010
Sold by
Benhase Richard
Bought by
Bonenfant Jennifer and Bonenfant Thomas
Home Financials for this Owner
Home Financials are based on the most recent Mortgage that was taken out on this home.
Original Mortgage
$61,264
Interest Rate
6.24%
Mortgage Type
Seller Take Back
Purchase Details
Closed on
Aug 17, 2001
Sold by
Grassman Ruth E
Bought by
Benhase Richard
Create a Home Valuation Report for This Property
The Home Valuation Report is an in-depth analysis detailing your home's value as well as a comparison with similar homes in the area
Home Values in the Area
Average Home Value in this Area
Purchase History
| Date | Buyer | Sale Price | Title Company |
|---|---|---|---|
| Bonenfant Jennifer | $61,264 | None Listed On Document | |
| Bonenfant Jennifer | $61,264 | None Available | |
| Benhase Richard | $85,000 | -- |
Source: Public Records
Mortgage History
| Date | Status | Borrower | Loan Amount |
|---|---|---|---|
| Previous Owner | Bonenfant Jennifer | $61,264 |
Source: Public Records
Tax History Compared to Growth
Tax History
| Year | Tax Paid | Tax Assessment Tax Assessment Total Assessment is a certain percentage of the fair market value that is determined by local assessors to be the total taxable value of land and additions on the property. | Land | Improvement |
|---|---|---|---|---|
| 2024 | $3,159 | $52,182 | $11,270 | $40,912 |
| 2023 | $3,165 | $52,182 | $11,270 | $40,912 |
| 2022 | $2,599 | $36,338 | $9,496 | $26,842 |
| 2021 | $2,585 | $36,338 | $9,496 | $26,842 |
| 2020 | $2,558 | $36,338 | $9,496 | $26,842 |
| 2019 | $2,505 | $31,875 | $8,330 | $23,545 |
| 2018 | $2,507 | $31,875 | $8,330 | $23,545 |
| 2017 | $2,428 | $31,875 | $8,330 | $23,545 |
| 2016 | $2,814 | $35,882 | $9,079 | $26,803 |
| 2015 | $2,522 | $35,882 | $9,079 | $26,803 |
| 2014 | $2,534 | $35,882 | $9,079 | $26,803 |
| 2013 | $2,363 | $32,921 | $8,330 | $24,591 |
Source: Public Records
Map
Nearby Homes
- 3753 N Berkley Cir
- 3817 Gardner Ave
- 7024 Ohio Ave
- 3805 O'Leary Ave
- 7215 Maryland Ave
- 4025 Deer Park Ave
- 7212 Maryland Ave
- 7651 Sagamore Dr
- 7675 Sagamore Dr
- 6773 Siebern Ave
- 4116 Superior Ave
- 7708 Eustis Ct
- 3566 Amberacres Dr
- 7400 Plainfield Rd
- 3563 Amberacres Dr
- 3542 Amberacres Dr
- 3521 Section Rd
- 6745 Belkenton Ave
- 6829 Alpine Ave
- 6914 Montgomery Rd
- 3750 N Berkley Cir
- 3740 N Berkley Cir
- 3736 N Berkley Cir
- 3756 N Berkley Cir
- 3734 N Berkley Cir
- 3795 Thornton Dr
- 3799 Thornton Dr
- 3803 Thornton Dr
- 3791 Thornton Dr
- 3785 Thornton Dr
- 3758 N Berkley Cir
- 3730 N Berkley Cir
- 3783 Thornton Dr
- 3751 N Berkley Cir
- 3749 N Berkley Cir
- 31 Thornton Dr Unit 31
- 3807 Thornton Dr
- 3808 N Berkley Cir
- 3747 N Berkley Cir
- 3726 N Berkley Cir