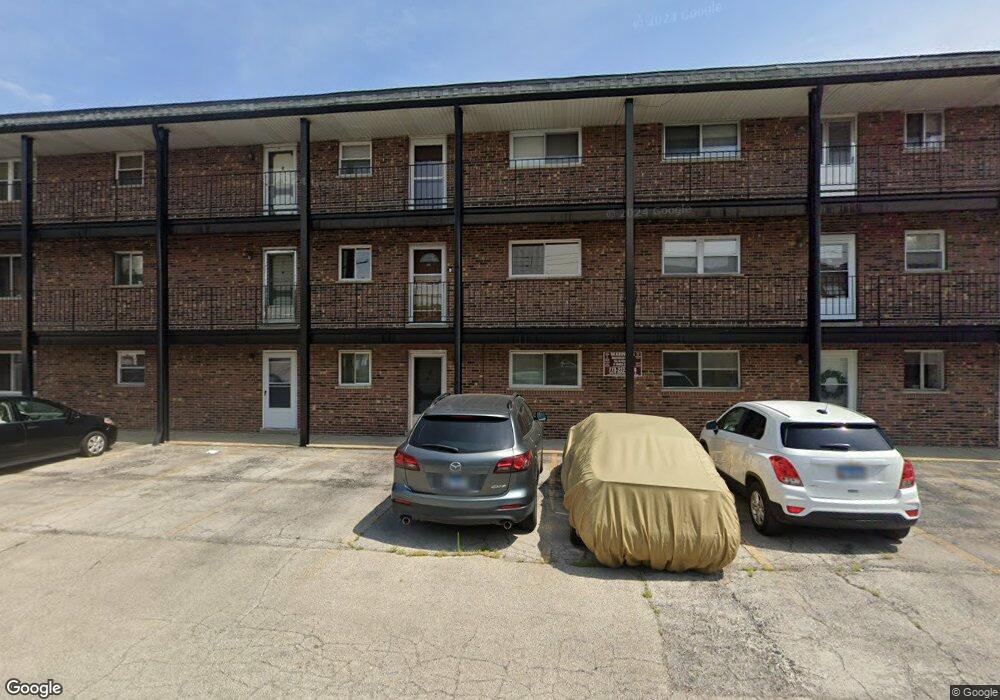
3746 N Central Ave Unit 1E Chicago, IL 60634
Portage Park NeighborhoodEstimated Value: $164,000 - $226,000
2
Beds
1
Bath
925
Sq Ft
$211/Sq Ft
Est. Value
About This Home
This home is located at 3746 N Central Ave Unit 1E, Chicago, IL 60634 and is currently estimated at $194,767, approximately $210 per square foot. 3746 N Central Ave Unit 1E is a home located in Cook County with nearby schools including William P Gray Elementary School, Schurz High School, and St. Bartholomew School.
Ownership History
Date
Name
Owned For
Owner Type
Purchase Details
Closed on
Dec 5, 2011
Sold by
Lunardini Sharlene Jo
Bought by
Rueda Edgar Marcelo and Tamayo Alba
Current Estimated Value
Purchase Details
Closed on
Sep 21, 2011
Sold by
Leptich Bernice A and Lunardini Sharlene Jo
Bought by
Lunardini Sharlene Jo and The Bernice A Leptich Irrevocable Granto
Purchase Details
Closed on
Jul 31, 2007
Sold by
Leptich Bernice A
Bought by
Leptich Bernice A and Lunardini Sharlene
Purchase Details
Closed on
Aug 10, 2005
Sold by
Stamena Rajlic
Bought by
Leptich Bernice A
Purchase Details
Closed on
Jun 4, 1999
Sold by
Savinski Frank L
Bought by
Rajlic Stamena
Home Financials for this Owner
Home Financials are based on the most recent Mortgage that was taken out on this home.
Original Mortgage
$66,400
Interest Rate
6.99%
Create a Home Valuation Report for This Property
The Home Valuation Report is an in-depth analysis detailing your home's value as well as a comparison with similar homes in the area
Home Values in the Area
Average Home Value in this Area
Purchase History
| Date | Buyer | Sale Price | Title Company |
|---|---|---|---|
| Rueda Edgar Marcelo | $65,000 | Alliance Title Corporation | |
| Lunardini Sharlene Jo | -- | None Available | |
| Leptich Bernice A | -- | None Available | |
| Leptich Bernice A | $190,000 | -- | |
| Rajlic Stamena | $83,000 | -- |
Source: Public Records
Mortgage History
| Date | Status | Borrower | Loan Amount |
|---|---|---|---|
| Previous Owner | Rajlic Stamena | $66,400 |
Source: Public Records
Tax History
| Year | Tax Paid | Tax Assessment Tax Assessment Total Assessment is a certain percentage of the fair market value that is determined by local assessors to be the total taxable value of land and additions on the property. | Land | Improvement |
|---|---|---|---|---|
| 2025 | $1,621 | $20,562 | $3,105 | $17,457 |
| 2024 | $1,621 | $20,562 | $3,105 | $17,457 |
| 2023 | $1,559 | $11,000 | $2,484 | $8,516 |
| 2022 | $1,559 | $11,000 | $2,484 | $8,516 |
| 2021 | $1,542 | $10,999 | $2,484 | $8,515 |
| 2020 | $1,155 | $8,288 | $1,108 | $7,180 |
| 2019 | $1,175 | $9,280 | $1,108 | $8,172 |
| 2018 | $1,155 | $9,280 | $1,108 | $8,172 |
| 2017 | $1,810 | $8,410 | $975 | $7,435 |
| 2016 | $1,684 | $8,410 | $975 | $7,435 |
| 2015 | $1,541 | $8,410 | $975 | $7,435 |
| 2014 | $2,698 | $14,540 | $931 | $13,609 |
| 2013 | $2,644 | $14,540 | $931 | $13,609 |
Source: Public Records
Map
Nearby Homes
- 3746 N Central Ave Unit 3D
- 5541 W Grace St
- 5525 W Berenice Ave
- 5700 W Grace St
- 3622 N Linder Ave
- 5758 W Warwick Ave
- 5416 W Waveland Ave
- 5410 W Grace St
- 3614 N Lotus Ave
- 5706 W Dakin St
- 5752 W Byron St
- 3516 N Central Ave
- 3514 N Central Ave
- 3512 N Central Ave
- 3508 N Central Ave
- 3506 N Central Ave
- 3504 N Central Ave
- 3502 N Central Ave
- 5529 W Cornelia Ave
- 4036 N Parkside Ave
- 3746 N Central Ave Unit 3A
- 3746 N Central Ave Unit 1G
- 3746 N Central Ave Unit 2A
- 3746 N Central Ave Unit 3E
- 3746 N Central Ave Unit 2H
- 3746 N Central Ave Unit 1F
- 3746 N Central Ave Unit 2B
- 3746 N Central Ave Unit 1A
- 3746 N Central Ave Unit 3H
- 3746 N Central Ave Unit 1C
- 3746 N Central Ave Unit 3F
- 3746 N Central Ave Unit 3C
- 3746 N Central Ave Unit 2G
- 3746 N Central Ave Unit 2F
- 3746 N Central Ave Unit 2E
- 3746 N Central Ave Unit 3G
- 3746 N Central Ave Unit 3B
- 3746 N Central Ave Unit 2C
- 3746 N Central Ave Unit 2D
- 3746 N Central Ave Unit 1D
Your Personal Tour Guide
Ask me questions while you tour the home.