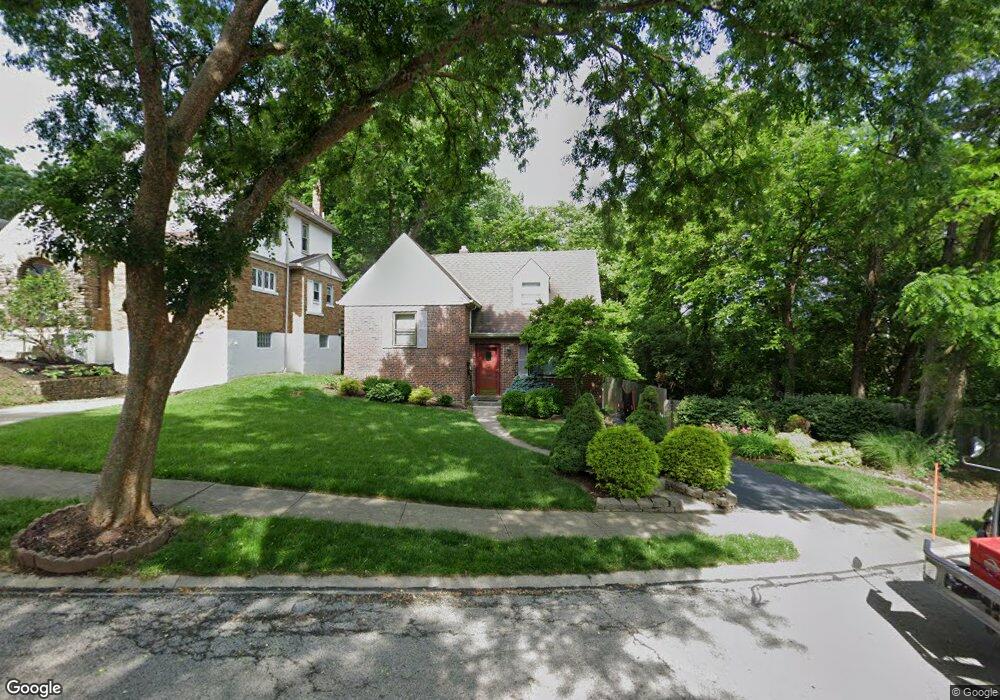
3747 Westgate Ave Cincinnati, OH 45208
Hyde Park NeighborhoodEstimated Value: $390,000 - $478,000
3
Beds
1
Bath
1,000
Sq Ft
$432/Sq Ft
Est. Value
About This Home
This home is located at 3747 Westgate Ave, Cincinnati, OH 45208 and is currently estimated at $432,305, approximately $432 per square foot. 3747 Westgate Ave is a home located in Hamilton County with nearby schools including Withrow University High School, Clark Montessori High School, and Shroder High School.
Ownership History
Date
Name
Owned For
Owner Type
Purchase Details
Closed on
Jun 7, 2022
Sold by
Brown Kelly R
Bought by
Kelly R Brown Revocable Trust
Current Estimated Value
Purchase Details
Closed on
Aug 22, 2001
Sold by
Sebastian Todd T Tr
Bought by
Brown Kelly R
Home Financials for this Owner
Home Financials are based on the most recent Mortgage that was taken out on this home.
Original Mortgage
$110,000
Interest Rate
7.03%
Mortgage Type
Unknown
Purchase Details
Closed on
Jan 28, 2000
Sold by
Sebastian Todd T
Bought by
Sebastian Todd T and Sebastian Kathleen L
Purchase Details
Closed on
Jan 31, 1994
Sold by
Gallagher Dennis and Gallagher Melissa M
Bought by
Sebastian Todd T
Purchase Details
Closed on
Oct 1, 1991
Sold by
Matthews Fred C and Matthews Carolyn D
Bought by
Gallagher Dennis and Gallagher Melissa M
Create a Home Valuation Report for This Property
The Home Valuation Report is an in-depth analysis detailing your home's value as well as a comparison with similar homes in the area
Home Values in the Area
Average Home Value in this Area
Purchase History
| Date | Buyer | Sale Price | Title Company |
|---|---|---|---|
| Kelly R Brown Revocable Trust | -- | Pennekamp Amy E | |
| Kelly R Brown Revocable Trust | -- | Pennekamp Amy E | |
| Brown Kelly R | $170,000 | -- | |
| Sebastian Todd T | -- | -- | |
| Sebastian Todd T | -- | -- | |
| Gallagher Dennis | -- | -- |
Source: Public Records
Mortgage History
| Date | Status | Borrower | Loan Amount |
|---|---|---|---|
| Previous Owner | Brown Kelly R | $110,000 |
Source: Public Records
Tax History Compared to Growth
Tax History
| Year | Tax Paid | Tax Assessment Tax Assessment Total Assessment is a certain percentage of the fair market value that is determined by local assessors to be the total taxable value of land and additions on the property. | Land | Improvement |
|---|---|---|---|---|
| 2024 | $6,633 | $111,073 | $57,477 | $53,596 |
| 2023 | $6,783 | $111,073 | $57,477 | $53,596 |
| 2022 | $6,498 | $95,453 | $47,625 | $47,828 |
| 2021 | $6,254 | $95,453 | $47,625 | $47,828 |
| 2020 | $6,438 | $95,453 | $47,625 | $47,828 |
| 2019 | $6,067 | $82,285 | $41,055 | $41,230 |
| 2018 | $6,077 | $82,285 | $41,055 | $41,230 |
| 2017 | $5,773 | $82,285 | $41,055 | $41,230 |
| 2016 | $5,077 | $71,341 | $39,158 | $32,183 |
| 2015 | $4,577 | $71,341 | $39,158 | $32,183 |
| 2014 | $4,610 | $71,341 | $39,158 | $32,183 |
| 2013 | $4,303 | $65,450 | $35,924 | $29,526 |
Source: Public Records
Map
Nearby Homes
- 2418 Morton Ave
- 3764 Grovedale Place
- 3790 Grovedale Place
- 3635 Barberry Ave
- 3600 Tamarack Ave
- 3923 S Madison Ave
- 3922 Grove Ave
- 3933 Grove Ave
- 3633 Stettinius Ave
- 3937 Grove Ave
- 3939 Grove Ave
- 4010 S Jefferson Ave
- 3649 Besuden Ct
- 3575 Potomac Ave
- 4026 Grove Ave
- 3528 Stettinius Ave
- 2444 Madison Rd
- 3950 Elsmere Ave
- 3743 Westgate Ave
- 3739 Westgate Ave
- 3735 Westgate Ave
- 3727 Westgate Ave
- 3728 Westgate Ave
- 3724 Westgate Ave
- 2484 Downing Dr
- 3720 Westgate Ave
- 2505 Marlington Ave
- 3714 Westgate Ave
- 3709 Westgate Ave
- 3708 Westgate Ave
- 2488 Downing Dr
- 3701 Westgate Ave
- 3704 Westgate Ave
- 3745 Middlebrook Ave
- 3741 Middlebrook Ave
- 2480 Downing Dr
- 3737 Middlebrook Ave
- 3751 Middlebrook Ave