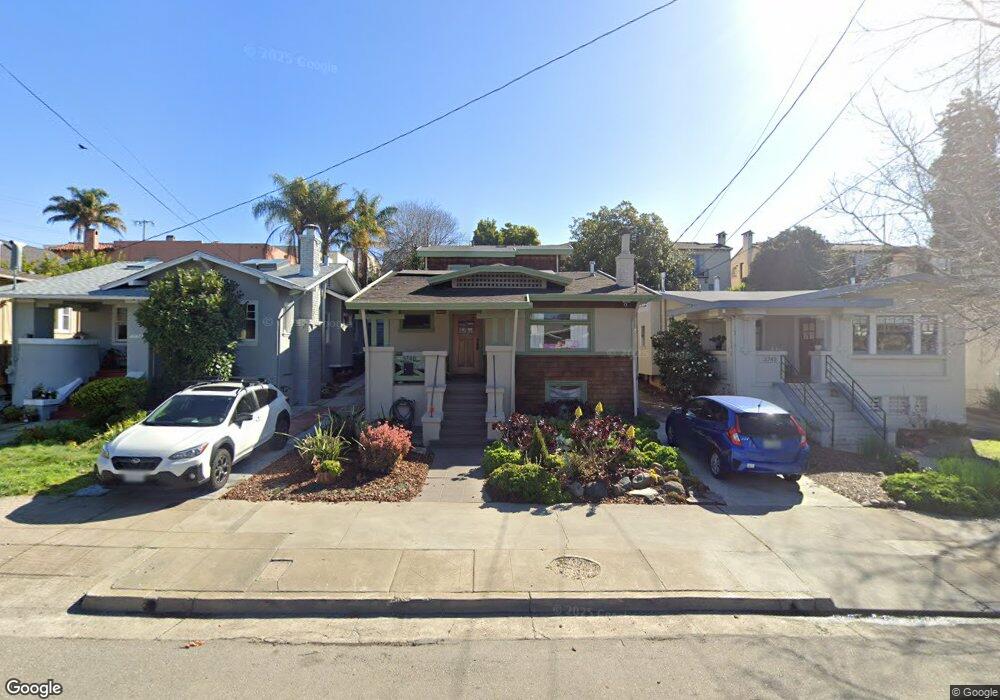
3748 Woodruff Ave Oakland, CA 94602
Glenview NeighborhoodEstimated Value: $1,005,000 - $1,579,000
3
Beds
2
Baths
1,553
Sq Ft
$838/Sq Ft
Est. Value
About This Home
This home is located at 3748 Woodruff Ave, Oakland, CA 94602 and is currently estimated at $1,302,179, approximately $838 per square foot. 3748 Woodruff Ave is a home located in Alameda County with nearby schools including Glenview Elementary School, Edna Brewer Middle School, and Oakland High School.
Ownership History
Date
Name
Owned For
Owner Type
Purchase Details
Closed on
Apr 15, 2018
Sold by
Hines Robert A and Hines Penny S
Bought by
Tobenkin Mark and Ruan Yang
Current Estimated Value
Home Financials for this Owner
Home Financials are based on the most recent Mortgage that was taken out on this home.
Original Mortgage
$1,024,000
Outstanding Balance
$880,623
Interest Rate
4.44%
Mortgage Type
New Conventional
Estimated Equity
$421,556
Purchase Details
Closed on
Jan 23, 1998
Sold by
Thaxton Cordelia J & Robert V 2Nd and Merrilee A
Bought by
Hines Robert and Hines Penny S
Home Financials for this Owner
Home Financials are based on the most recent Mortgage that was taken out on this home.
Original Mortgage
$149,150
Interest Rate
7.05%
Purchase Details
Closed on
Jan 22, 1998
Sold by
Hines Robert and Hines Penny S
Bought by
Hines Robert A and Hines Penny S
Home Financials for this Owner
Home Financials are based on the most recent Mortgage that was taken out on this home.
Original Mortgage
$149,150
Interest Rate
7.05%
Create a Home Valuation Report for This Property
The Home Valuation Report is an in-depth analysis detailing your home's value as well as a comparison with similar homes in the area
Home Values in the Area
Average Home Value in this Area
Purchase History
| Date | Buyer | Sale Price | Title Company |
|---|---|---|---|
| Tobenkin Mark | $1,280,000 | Old Republic Title Company | |
| Hines Robert | $157,000 | Chicago Title | |
| Hines Robert A | -- | Chicago Title Co |
Source: Public Records
Mortgage History
| Date | Status | Borrower | Loan Amount |
|---|---|---|---|
| Open | Tobenkin Mark | $1,024,000 | |
| Previous Owner | Hines Robert | $149,150 |
Source: Public Records
Tax History Compared to Growth
Tax History
| Year | Tax Paid | Tax Assessment Tax Assessment Total Assessment is a certain percentage of the fair market value that is determined by local assessors to be the total taxable value of land and additions on the property. | Land | Improvement |
|---|---|---|---|---|
| 2025 | $19,844 | $1,456,396 | $436,919 | $1,019,477 |
| 2024 | $19,844 | $1,427,840 | $428,352 | $999,488 |
| 2023 | $21,006 | $1,399,845 | $419,953 | $979,892 |
| 2022 | $20,567 | $1,372,402 | $411,720 | $960,682 |
| 2021 | $19,904 | $1,345,497 | $403,649 | $941,848 |
| 2020 | $19,692 | $1,331,711 | $399,513 | $932,198 |
| 2019 | $19,104 | $1,305,600 | $391,680 | $913,920 |
| 2018 | $5,183 | $297,557 | $66,094 | $231,463 |
| 2017 | $4,964 | $291,724 | $64,799 | $226,925 |
| 2016 | $4,749 | $286,005 | $63,528 | $222,477 |
| 2015 | $4,721 | $281,710 | $62,574 | $219,136 |
| 2014 | $4,716 | $276,193 | $61,349 | $214,844 |
Source: Public Records
Map
Nearby Homes
- 1621 E 38th St
- 1703 Macarthur Blvd
- 1701 Macarthur Blvd
- 1515 Hampel St
- 3945 Randolph Ave Unit 2
- 3541 Dimond Ave
- 1777 Sausal St
- 2106 Woodbine Ave
- 3186 Mckillop Rd
- 1235 Hampel St
- 1233 Hampel St
- 1600 E 31st St
- 2550 Pleasant St
- 2240 Macarthur Blvd
- 3937 Greenwood Ave
- 3464 Champion St
- 4426 Park Blvd
- 1458 E 33rd St
- 3123 Beaumont Ave
- 3754 Woodruff Ave
- 3742 Woodruff Ave
- 3736 Woodruff Ave
- 3760 Woodruff Ave
- 28 Elston Ct
- 3732 Woodruff Ave
- 1669 E 38th St
- 1657 E 38th St
- 1655 E 38th St
- 16 Elston Ct
- 1675 E 38th St
- 3728 Woodruff Ave
- 1659 E 38th St
- 21 Elston Ct
- 1701 E 38th St
- 3747 Woodruff Ave
- 3741 Woodruff Ave
- 3753 Woodruff Ave
- 3735 Woodruff Ave
- 3759 Woodruff Ave