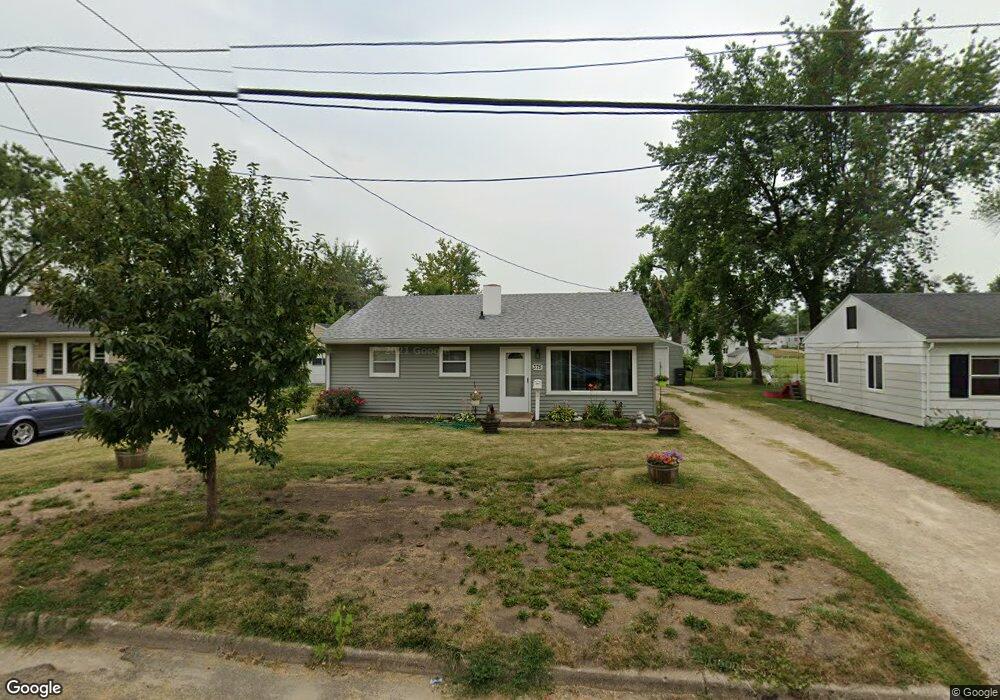
375 26th Ave SW Cedar Rapids, IA 52404
Southwest Area NeighborhoodEstimated Value: $155,000 - $172,000
3
Beds
1
Bath
1,243
Sq Ft
$131/Sq Ft
Est. Value
About This Home
This home is located at 375 26th Ave SW, Cedar Rapids, IA 52404 and is currently estimated at $162,389, approximately $130 per square foot. 375 26th Ave SW is a home located in Linn County with nearby schools including Junction City Elementary School, Grant Elementary School, and Bruce Hall Day Treatment Center.
Ownership History
Date
Name
Owned For
Owner Type
Purchase Details
Closed on
Jul 11, 2018
Sold by
Thomas Larry D and Thomas Esther N
Bought by
Solem Susan G
Current Estimated Value
Home Financials for this Owner
Home Financials are based on the most recent Mortgage that was taken out on this home.
Original Mortgage
$48,550
Outstanding Balance
$42,076
Interest Rate
4.5%
Mortgage Type
New Conventional
Estimated Equity
$120,313
Purchase Details
Closed on
Jun 29, 2005
Sold by
Nassif Douglas and Nassif Douglas G
Bought by
Thomas Larry D and Thomas Esther N
Home Financials for this Owner
Home Financials are based on the most recent Mortgage that was taken out on this home.
Original Mortgage
$95,275
Interest Rate
5.86%
Mortgage Type
Fannie Mae Freddie Mac
Purchase Details
Closed on
Nov 29, 2004
Sold by
Snitker Steven P and Snitker Robin
Bought by
Countrywide Home Loans Inc
Purchase Details
Closed on
Nov 23, 2004
Sold by
Countrywide Home Loans Inc
Bought by
Nassif Douglas
Create a Home Valuation Report for This Property
The Home Valuation Report is an in-depth analysis detailing your home's value as well as a comparison with similar homes in the area
Home Values in the Area
Average Home Value in this Area
Purchase History
| Date | Buyer | Sale Price | Title Company |
|---|---|---|---|
| Solem Susan G | $89,000 | None Available | |
| Thomas Larry D | $95,000 | -- | |
| Countrywide Home Loans Inc | $70,766 | -- | |
| Nassif Douglas | $62,000 | -- |
Source: Public Records
Mortgage History
| Date | Status | Borrower | Loan Amount |
|---|---|---|---|
| Open | Solem Susan G | $48,550 | |
| Previous Owner | Thomas Larry D | $95,275 |
Source: Public Records
Tax History Compared to Growth
Tax History
| Year | Tax Paid | Tax Assessment Tax Assessment Total Assessment is a certain percentage of the fair market value that is determined by local assessors to be the total taxable value of land and additions on the property. | Land | Improvement |
|---|---|---|---|---|
| 2025 | $2,158 | $165,300 | $29,100 | $136,200 |
| 2024 | $2,588 | $153,900 | $29,100 | $124,800 |
| 2023 | $2,588 | $139,400 | $24,500 | $114,900 |
| 2022 | $2,220 | $131,600 | $21,400 | $110,200 |
| 2021 | $2,314 | $116,100 | $21,400 | $94,700 |
| 2020 | $2,314 | $113,500 | $18,400 | $95,100 |
| 2019 | $1,620 | $86,900 | $18,400 | $68,500 |
| 2018 | $1,568 | $86,900 | $18,400 | $68,500 |
| 2017 | $1,632 | $86,700 | $18,400 | $68,300 |
| 2016 | $1,815 | $88,700 | $18,400 | $70,300 |
| 2015 | $1,861 | $90,751 | $18,360 | $72,391 |
| 2014 | $1,676 | $93,647 | $18,360 | $75,287 |
| 2013 | $1,694 | $93,647 | $18,360 | $75,287 |
Source: Public Records
Map
Nearby Homes
- 2536 L St SW
- 2511 Indiana St SW
- 2417 Illinois St SW
- 648 22nd Ave SW
- 826 21st Ave SW
- 90 29th Ave SW
- 186 22nd Ave SW
- 148 33rd Ave SW
- 1804 I St SW
- 2021 Hamilton St SW
- 657 16th Ave SW
- 1132 21st Ave SW
- 2818 Southland St SW
- 1621 9th St SW
- 1617 9th St SW
- 1435 N St SW
- 1426 N St SW
- 815 15th Ave SW
- 1323 M St SW
- 2937 Southland St SW
- 381 26th Ave SW
- 367 26th Ave SW
- 387 26th Ave SW
- 363 26th Ave SW
- 368 26th Ave SW
- 382 27th Ave SW
- 364 26th Ave SW
- 372 26th Ave SW
- 393 26th Ave SW
- 376 26th Ave SW
- 360 26th Ave SW
- 380 26th Ave SW
- 400 27th Ave SW
- 403 26th Ave SW
- 2524 Illinois St SW
- 384 26th Ave SW
- 2520 Illinois St SW
- 2545 Indiana St SW
- 2528 Illinois St SW
- 2539 Wisconsin St SW