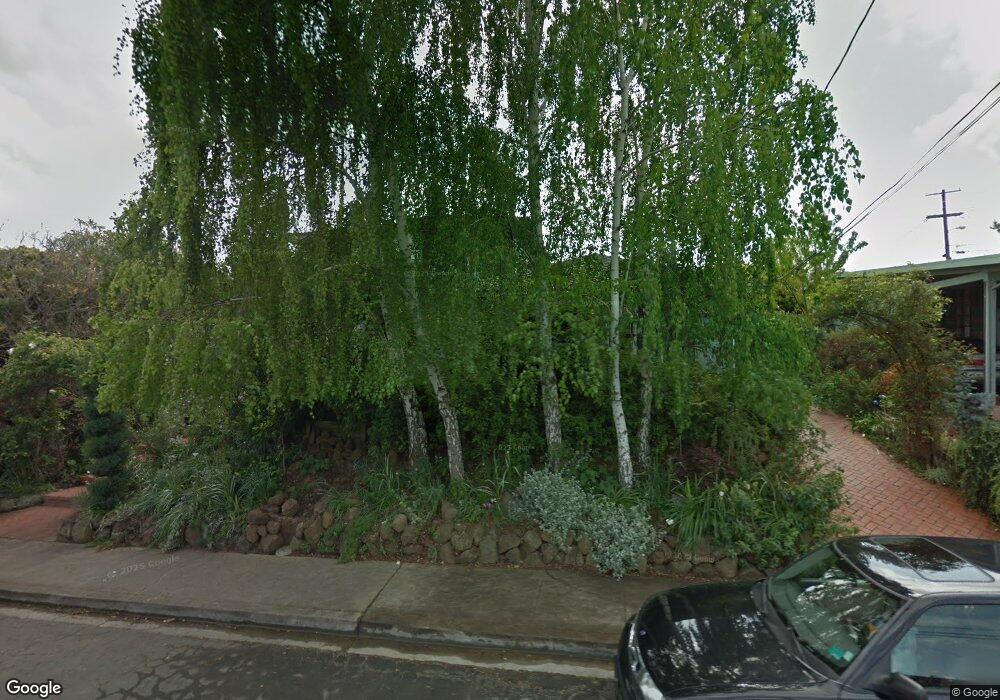
375 De Anza Ave San Carlos, CA 94070
Alder Manor NeighborhoodEstimated Value: $2,249,427 - $2,552,000
3
Beds
3
Baths
2,340
Sq Ft
$1,022/Sq Ft
Est. Value
About This Home
This home is located at 375 De Anza Ave, San Carlos, CA 94070 and is currently estimated at $2,392,607, approximately $1,022 per square foot. 375 De Anza Ave is a home located in San Mateo County with nearby schools including Clifford School, John F. Kennedy Middle School, and Sequoia High School.
Ownership History
Date
Name
Owned For
Owner Type
Purchase Details
Closed on
Apr 15, 1994
Sold by
Denning Ronald R and Denning Mary Anne
Bought by
Anderson Lynne
Current Estimated Value
Home Financials for this Owner
Home Financials are based on the most recent Mortgage that was taken out on this home.
Original Mortgage
$168,100
Interest Rate
7.79%
Create a Home Valuation Report for This Property
The Home Valuation Report is an in-depth analysis detailing your home's value as well as a comparison with similar homes in the area
Home Values in the Area
Average Home Value in this Area
Purchase History
| Date | Buyer | Sale Price | Title Company |
|---|---|---|---|
| Anderson Lynne | $346,000 | Fidelity National Title Ins |
Source: Public Records
Mortgage History
| Date | Status | Borrower | Loan Amount |
|---|---|---|---|
| Closed | Anderson Lynne | $168,100 |
Source: Public Records
Tax History Compared to Growth
Tax History
| Year | Tax Paid | Tax Assessment Tax Assessment Total Assessment is a certain percentage of the fair market value that is determined by local assessors to be the total taxable value of land and additions on the property. | Land | Improvement |
|---|---|---|---|---|
| 2025 | $7,958 | $588,066 | $294,033 | $294,033 |
| 2023 | $7,958 | $565,232 | $282,616 | $282,616 |
| 2022 | $7,522 | $554,150 | $277,075 | $277,075 |
| 2021 | $7,403 | $543,286 | $271,643 | $271,643 |
| 2020 | $7,265 | $537,716 | $268,858 | $268,858 |
| 2019 | $7,193 | $527,174 | $263,587 | $263,587 |
| 2018 | $6,989 | $516,838 | $258,419 | $258,419 |
| 2017 | $6,871 | $506,704 | $253,352 | $253,352 |
| 2016 | $6,712 | $496,770 | $248,385 | $248,385 |
| 2015 | $6,505 | $489,310 | $244,655 | $244,655 |
| 2014 | $6,324 | $479,726 | $239,863 | $239,863 |
Source: Public Records
Map
Nearby Homes