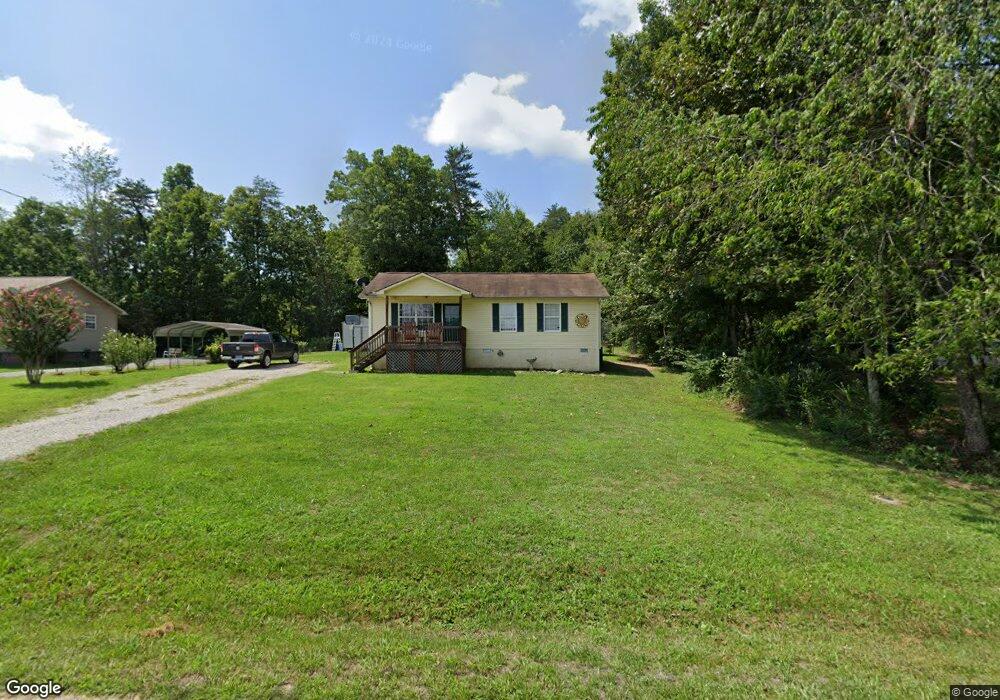
375 Iris Cir Crossville, TN 38555
Estimated Value: $181,997 - $228,000
--
Bed
2
Baths
1,080
Sq Ft
$197/Sq Ft
Est. Value
About This Home
This home is located at 375 Iris Cir, Crossville, TN 38555 and is currently estimated at $212,249, approximately $196 per square foot. 375 Iris Cir is a home located in Cumberland County with nearby schools including Glenn Martin Elementary School, Cumberland County High School, and Christian Academy of the Cumberlands.
Ownership History
Date
Name
Owned For
Owner Type
Purchase Details
Closed on
May 8, 2019
Sold by
Adkisson Amanda Nicole and Rucker Amanda Nicole
Bought by
Adkisson Christopher Shawn
Current Estimated Value
Purchase Details
Closed on
Nov 24, 2009
Sold by
Adkisson Christopher Shawn
Bought by
Adkisson Amanda Nicole
Purchase Details
Closed on
Dec 12, 2007
Sold by
Cumberland Cty Habitatfor
Bought by
Adkisson Christopher Shawn
Purchase Details
Closed on
Apr 15, 2004
Sold by
Miller W E
Bought by
Cumberland County Habitat For
Create a Home Valuation Report for This Property
The Home Valuation Report is an in-depth analysis detailing your home's value as well as a comparison with similar homes in the area
Home Values in the Area
Average Home Value in this Area
Purchase History
| Date | Buyer | Sale Price | Title Company |
|---|---|---|---|
| Adkisson Christopher Shawn | -- | None Available | |
| Adkisson Amanda Nicole | -- | -- | |
| Adkisson Christopher Shawn | $90,000 | -- | |
| Cumberland County Habitat For | $3,000 | -- |
Source: Public Records
Tax History Compared to Growth
Tax History
| Year | Tax Paid | Tax Assessment Tax Assessment Total Assessment is a certain percentage of the fair market value that is determined by local assessors to be the total taxable value of land and additions on the property. | Land | Improvement |
|---|---|---|---|---|
| 2024 | $347 | $30,550 | $3,125 | $27,425 |
| 2023 | $347 | $30,550 | $0 | $0 |
| 2022 | $532 | $30,550 | $3,125 | $27,425 |
| 2021 | $479 | $20,725 | $3,125 | $17,600 |
| 2020 | $324 | $20,725 | $3,125 | $17,600 |
| 2019 | $446 | $20,725 | $3,125 | $17,600 |
| 2018 | $446 | $20,725 | $3,125 | $17,600 |
| 2017 | $446 | $20,725 | $3,125 | $17,600 |
| 2016 | $437 | $20,250 | $3,125 | $17,125 |
| 2015 | $431 | $20,250 | $3,125 | $17,125 |
| 2014 | $410 | $20,239 | $0 | $0 |
Source: Public Records
Map
Nearby Homes