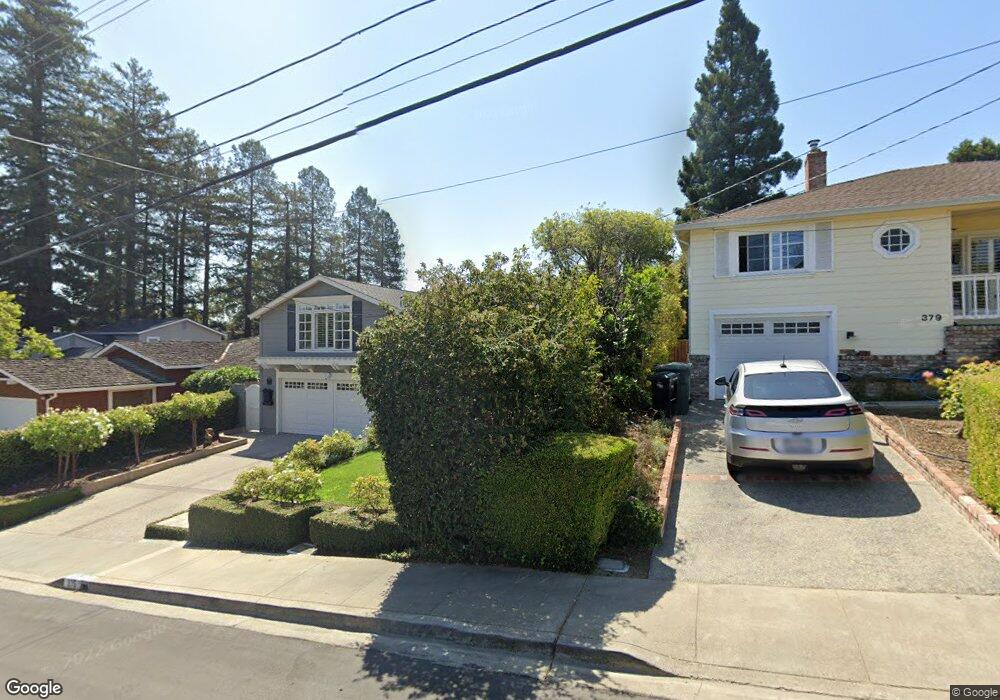
375 Ridge Rd San Carlos, CA 94070
Alder Manor NeighborhoodEstimated Value: $2,058,000 - $2,474,000
2
Beds
2
Baths
1,510
Sq Ft
$1,505/Sq Ft
Est. Value
About This Home
This home is located at 375 Ridge Rd, San Carlos, CA 94070 and is currently estimated at $2,272,844, approximately $1,505 per square foot. 375 Ridge Rd is a home located in San Mateo County with nearby schools including Clifford School, John F. Kennedy Middle School, and Sequoia High School.
Ownership History
Date
Name
Owned For
Owner Type
Purchase Details
Closed on
Oct 19, 2017
Sold by
Glazer Michael P and Glazer Gina M
Bought by
Glazer Michael Peter and Glazer Gina Marie
Current Estimated Value
Purchase Details
Closed on
Oct 31, 2001
Sold by
Glazer Joseph A and Glazer Giuliana
Bought by
Glazer Michael P and Glazer Gina M
Purchase Details
Closed on
May 11, 1999
Sold by
Aberer James B
Bought by
Glazer Joseph A and Glazer Giuliana
Home Financials for this Owner
Home Financials are based on the most recent Mortgage that was taken out on this home.
Original Mortgage
$350,000
Interest Rate
4.35%
Purchase Details
Closed on
Jan 1, 1999
Sold by
Aberer Sandra T
Bought by
Aberer Gwendolyn L M
Purchase Details
Closed on
Dec 16, 1998
Sold by
Aberer Sandra T
Bought by
Aberer Gwendolyn L M
Purchase Details
Closed on
Nov 3, 1995
Sold by
Aberer James B and Aberer Gwendolyn
Bought by
Aberer James B and Aberer James B
Create a Home Valuation Report for This Property
The Home Valuation Report is an in-depth analysis detailing your home's value as well as a comparison with similar homes in the area
Home Values in the Area
Average Home Value in this Area
Purchase History
| Date | Buyer | Sale Price | Title Company |
|---|---|---|---|
| Glazer Michael Peter | -- | Nat | |
| Glazer Michael P | -- | -- | |
| Glazer Joseph A | $551,500 | North American Title Insuran | |
| Aberer Gwendolyn L M | -- | -- | |
| Aberer Gwendolyn L M | -- | -- | |
| Aberer James B | -- | Fidelity National Title |
Source: Public Records
Mortgage History
| Date | Status | Borrower | Loan Amount |
|---|---|---|---|
| Previous Owner | Glazer Joseph A | $350,000 |
Source: Public Records
Tax History Compared to Growth
Tax History
| Year | Tax Paid | Tax Assessment Tax Assessment Total Assessment is a certain percentage of the fair market value that is determined by local assessors to be the total taxable value of land and additions on the property. | Land | Improvement |
|---|---|---|---|---|
| 2025 | $10,956 | $864,578 | $432,289 | $432,289 |
| 2023 | $10,956 | $831,006 | $415,503 | $415,503 |
| 2022 | $10,334 | $814,712 | $407,356 | $407,356 |
| 2021 | $10,188 | $798,738 | $399,369 | $399,369 |
| 2020 | $10,012 | $790,548 | $395,274 | $395,274 |
| 2019 | $9,932 | $775,048 | $387,524 | $387,524 |
| 2018 | $9,657 | $759,852 | $379,926 | $379,926 |
| 2017 | $9,433 | $744,954 | $372,477 | $372,477 |
| 2016 | $9,237 | $730,348 | $365,174 | $365,174 |
| 2015 | $8,934 | $719,378 | $359,689 | $359,689 |
| 2014 | $8,714 | $705,288 | $352,644 | $352,644 |
Source: Public Records
Map
Nearby Homes
- 186 Wildwood Ave
- 2611 Thornhill Dr
- 161 Oakview Dr
- 80 Hilltop Dr
- 100 Garnet Ave
- 373 Oakview Dr
- 160 Rogers Ave
- 2595 Eaton Ave
- 329 Oakview Dr
- 2936 Eaton Ave
- 760 Loma Ct
- 0 S Palomar Dr
- 00 Devonshire
- 20 Don Ct
- 758 Loma
- 00 S Palomar Dr
- 416 Palomar Dr
- 438 Portofino Dr Unit 101
- 865 Somerset Ct
- 3104 Brittan Ave