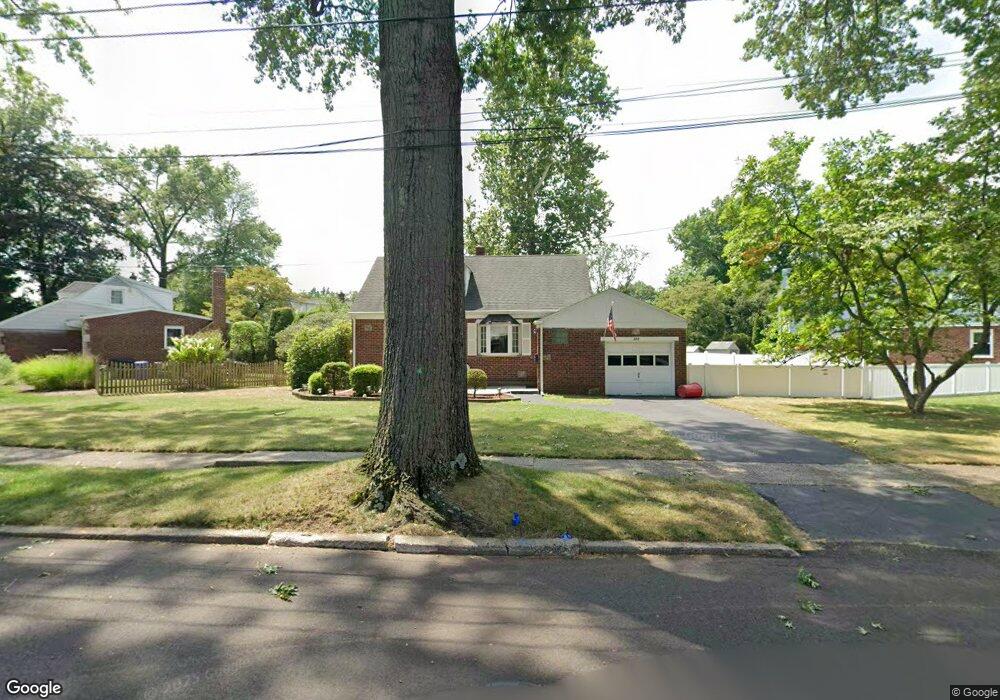
375 the Fenway River Edge, NJ 07661
Estimated Value: $663,000 - $807,000
--
Bed
--
Bath
1,366
Sq Ft
$542/Sq Ft
Est. Value
About This Home
This home is located at 375 the Fenway, River Edge, NJ 07661 and is currently estimated at $740,600, approximately $542 per square foot. 375 the Fenway is a home located in Bergen County with nearby schools including Cherry Hill School, River Dell Middle School, and River Dell Regional High School.
Ownership History
Date
Name
Owned For
Owner Type
Purchase Details
Closed on
Aug 30, 2005
Sold by
Shetson Robert
Bought by
Mendoza Juan and Peralta Mireya
Current Estimated Value
Home Financials for this Owner
Home Financials are based on the most recent Mortgage that was taken out on this home.
Original Mortgage
$300,000
Outstanding Balance
$160,097
Interest Rate
5.81%
Estimated Equity
$580,503
Purchase Details
Closed on
Mar 31, 1998
Sold by
Ludwig Thomas C and Ludwig Susan E
Bought by
Shetsen Robert and Shetsen Margarita
Home Financials for this Owner
Home Financials are based on the most recent Mortgage that was taken out on this home.
Original Mortgage
$169,600
Interest Rate
7.87%
Create a Home Valuation Report for This Property
The Home Valuation Report is an in-depth analysis detailing your home's value as well as a comparison with similar homes in the area
Home Values in the Area
Average Home Value in this Area
Purchase History
| Date | Buyer | Sale Price | Title Company |
|---|---|---|---|
| Mendoza Juan | $427,500 | -- | |
| Shetsen Robert | $212,000 | -- |
Source: Public Records
Mortgage History
| Date | Status | Borrower | Loan Amount |
|---|---|---|---|
| Open | Mendoza Juan | $300,000 | |
| Previous Owner | Shetsen Robert | $169,600 |
Source: Public Records
Tax History Compared to Growth
Tax History
| Year | Tax Paid | Tax Assessment Tax Assessment Total Assessment is a certain percentage of the fair market value that is determined by local assessors to be the total taxable value of land and additions on the property. | Land | Improvement |
|---|---|---|---|---|
| 2025 | $13,255 | $550,300 | $326,900 | $223,400 |
| 2024 | $12,924 | $334,300 | $212,800 | $121,500 |
| 2023 | $12,369 | $334,300 | $212,800 | $121,500 |
| 2022 | $12,369 | $334,300 | $212,800 | $121,500 |
| 2021 | $12,125 | $334,300 | $212,800 | $121,500 |
| 2020 | $11,935 | $334,300 | $212,800 | $121,500 |
| 2019 | $11,594 | $334,300 | $212,800 | $121,500 |
| 2018 | $11,349 | $334,300 | $212,800 | $121,500 |
| 2017 | $11,239 | $334,300 | $212,800 | $121,500 |
| 2016 | $10,985 | $334,300 | $212,800 | $121,500 |
| 2015 | $10,754 | $334,300 | $212,800 | $121,500 |
| 2014 | $10,774 | $334,300 | $212,800 | $121,500 |
Source: Public Records
Map
Nearby Homes
- 421 Lafayette Ave
- 212 Lozier Terrace
- 302 Howland Ave
- 12 Gainesborough Terrace Unit 1B
- 293 Bogert Rd Unit 1A
- 255 Bogert Rd Unit 2A
- 222 Zabriskie Place
- 214 Zabriskie Place
- 215 Kensington Rd
- 165 Mohawk Dr
- 378 Windsor Rd
- 168 Voorhis Ave
- 42 Howland Ave
- 192 Valley Rd
- 81 Eastbrook Dr
- 42 Eastbrook Dr
- 16 Coles Ct
- 55 Rutgers Place
- 276 Greenway Terrace
- 1061 Roosevelt Ave