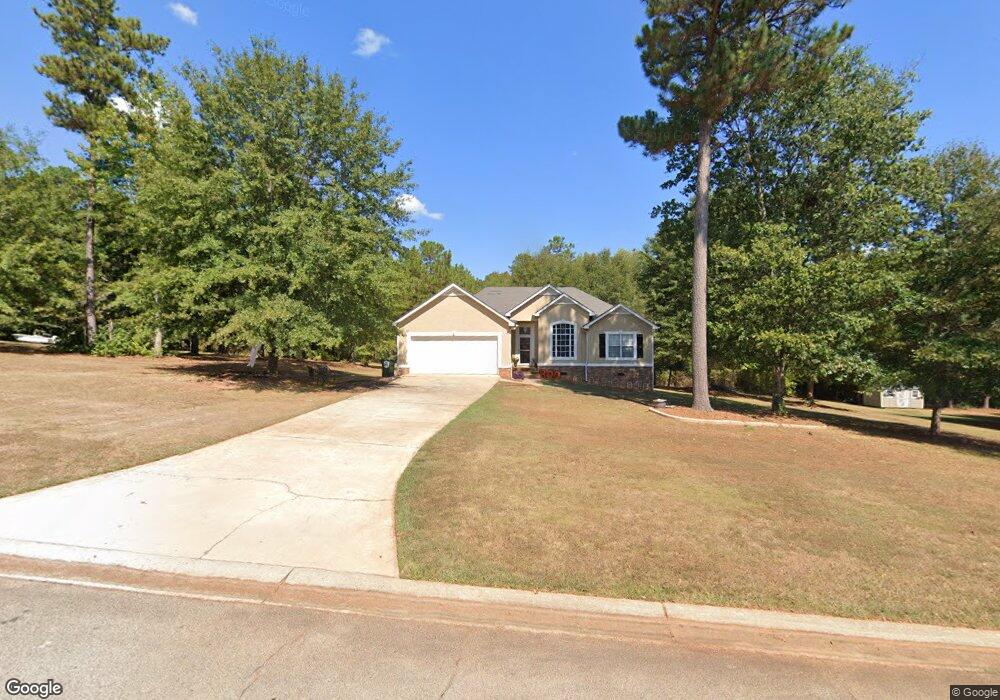
375 Whitfield Walk Unit 9 Zebulon, GA 30295
Estimated Value: $294,000 - $312,000
3
Beds
2
Baths
1,296
Sq Ft
$232/Sq Ft
Est. Value
About This Home
This home is located at 375 Whitfield Walk Unit 9, Zebulon, GA 30295 and is currently estimated at $301,175, approximately $232 per square foot. 375 Whitfield Walk Unit 9 is a home located in Pike County with nearby schools including Pike County Primary School, Pike County Elementary School, and Pike County Middle School.
Ownership History
Date
Name
Owned For
Owner Type
Purchase Details
Closed on
Aug 13, 2021
Sold by
Holmes Michael Stephen
Bought by
Bonner Jarrod and Mcghee Jennifer
Current Estimated Value
Home Financials for this Owner
Home Financials are based on the most recent Mortgage that was taken out on this home.
Original Mortgage
$242,250
Outstanding Balance
$219,948
Interest Rate
2.8%
Mortgage Type
New Conventional
Estimated Equity
$81,227
Purchase Details
Closed on
Feb 8, 2019
Sold by
Sullivan April Teal
Bought by
Holmes Michael Stephen and Holmes Laurie C
Home Financials for this Owner
Home Financials are based on the most recent Mortgage that was taken out on this home.
Original Mortgage
$147,600
Interest Rate
4.4%
Mortgage Type
New Conventional
Purchase Details
Closed on
Nov 30, 2006
Sold by
Perry Tammy L
Bought by
Sullivan April Teal
Home Financials for this Owner
Home Financials are based on the most recent Mortgage that was taken out on this home.
Original Mortgage
$129,960
Interest Rate
6.29%
Mortgage Type
New Conventional
Purchase Details
Closed on
Mar 28, 2002
Sold by
Ark Builder Inc Dba Ark Development
Bought by
Perry Tammy L
Create a Home Valuation Report for This Property
The Home Valuation Report is an in-depth analysis detailing your home's value as well as a comparison with similar homes in the area
Home Values in the Area
Average Home Value in this Area
Purchase History
| Date | Buyer | Sale Price | Title Company |
|---|---|---|---|
| Bonner Jarrod | $255,854 | -- | |
| Holmes Michael Stephen | $164,000 | -- | |
| Sullivan April Teal | $132,000 | -- | |
| Perry Tammy L | $126,000 | -- |
Source: Public Records
Mortgage History
| Date | Status | Borrower | Loan Amount |
|---|---|---|---|
| Open | Bonner Jarrod | $242,250 | |
| Previous Owner | Holmes Michael Stephen | $147,600 | |
| Previous Owner | Sullivan April Teal | $129,960 |
Source: Public Records
Tax History Compared to Growth
Tax History
| Year | Tax Paid | Tax Assessment Tax Assessment Total Assessment is a certain percentage of the fair market value that is determined by local assessors to be the total taxable value of land and additions on the property. | Land | Improvement |
|---|---|---|---|---|
| 2024 | $1,930 | $79,789 | $15,200 | $64,589 |
| 2023 | $2,260 | $79,789 | $15,200 | $64,589 |
| 2022 | $1,589 | $56,672 | $9,200 | $47,472 |
| 2021 | $1,702 | $56,672 | $9,200 | $47,472 |
| 2020 | $1,722 | $56,672 | $9,200 | $47,472 |
| 2019 | $1,529 | $46,184 | $9,200 | $36,984 |
| 2018 | $1,530 | $46,184 | $9,200 | $36,984 |
| 2017 | $1,518 | $46,184 | $9,200 | $36,984 |
| 2016 | $1,408 | $46,184 | $9,200 | $36,984 |
| 2015 | $1,340 | $46,184 | $9,200 | $36,984 |
| 2014 | $1,360 | $46,184 | $9,200 | $36,984 |
| 2013 | -- | $46,184 | $9,200 | $36,984 |
Source: Public Records
Map
Nearby Homes
- 98 Whitfield Bend
- 637 Whitfield Walk
- 681 Whitfield Walk
- 223 Arthur Rd
- 1004 Mill Race Unit 4
- 1019 Mill Race Unit 19
- 1003 Mill Race Unit 3
- 1002 Mill Race Unit 2
- The Kimbrell II 1-F Plan at Mill Pond
- The Logan 1-F Plan at Mill Pond
- The Dakota 1-F Plan at Mill Pond
- The Milton I 1-F Plan at Mill Pond
- The Brightstar 1-F Plan at Mill Pond
- 456 M l King jr Cir
- 123 Griffin St
- 244 Wrightsburg Way
- 106 Wrightsburg Way
- 94 Wrightsburg Way
- 308 Wrightsburg Way
- 203 Pine St
- 375 Whitfield Walk
- 407 Whitfield Walk Unit 10
- 407 Whitfield Walk
- 337 Whitfield Walk
- 356 Whitfield Walk Unit 15
- 356 Whitfield Walk
- 445 Whitfield Walk
- 406 Whitfield Walk
- 299 Whitfield Walk
- 324 Whitfield Walk
- 440 Whitfield Walk
- 280 Whitfield Walk
- 493 Whitfield Walk
- 99 Whitfield Bend
- 496 Whitfield Walk
- 517 Whitfield Walk
- 90 Journeys End
- 212 Whitfield Walk
- 534 Whitfield Walk
- 0 Whitfield Bend Unit LOT 83 7332882