3750 80th St E Inver Grove Heights, MN 55076
Estimated payment $2,434/month
Highlights
- Deck
- Home Office
- 3 Car Attached Garage
- No HOA
- The kitchen features windows
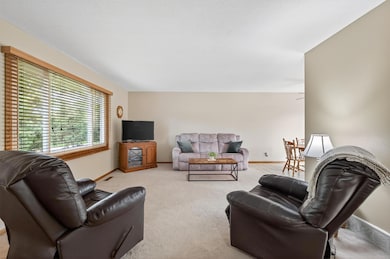
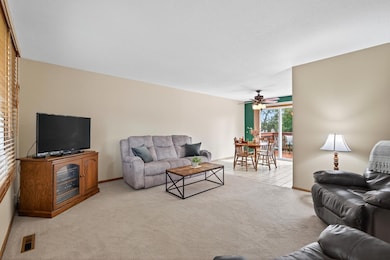
- Living Room
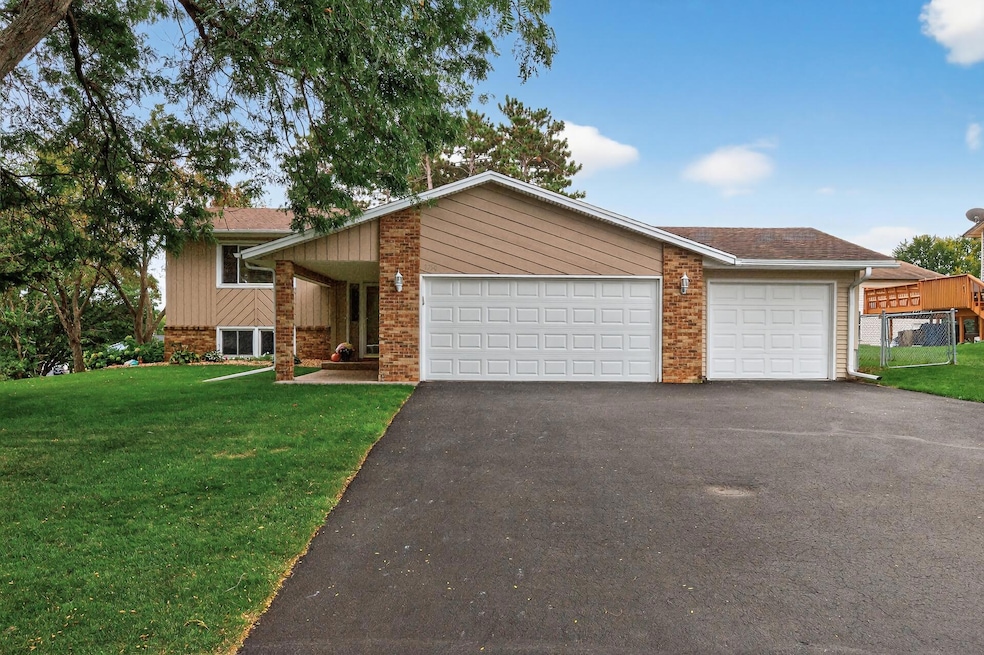
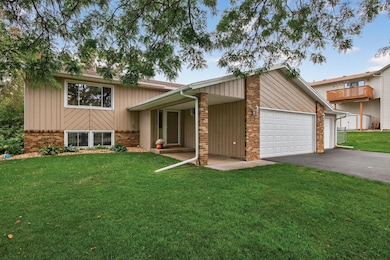
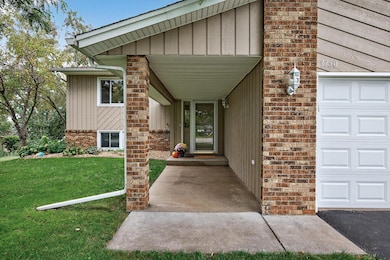
About This Home
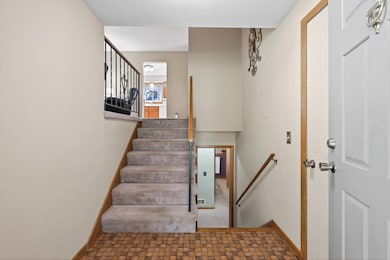
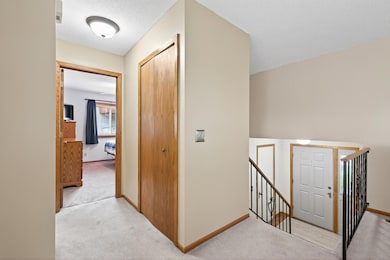
Welcome to this well-maintained home in the heart of Inver Grove Heights! Nestled in an established neighborhood, this home offers a functional layout, large living spaces, a great backyard and more! Come upstairs to find a bright and spacious upper level featuring large windows, and an open concept living and dining area and a super functional kitchen. The upper level also includes two comfortable bedrooms and a full bathroom, while the lower level features a family room ideal for entertaining, a third bedroom, a second bath, and office space/ potential 4th bedroom. Whether you’re looking to refresh finishes or reimagine the space, the potential here is endless. Outside, enjoy a generous well-cared for backyard with a large shed, a raised deck, firepit, and room to create your ideal outdoor living space. The attached three-car garage provides extra storage and convenience...Bring the boat! Close to schools, Sleepy Hollow Park, shopping, and major highways, it combines suburban peace with city access. Check out this home today!
Home Details
Home Type
- Single Family
Est. Annual Taxes
- $3,954
Year Built
- Built in 1983
Lot Details
- 0.28 Acre Lot
- Lot Dimensions are 85x141x85x141
- Partially Fenced Property
- Chain Link Fence
- Many Trees
Parking
- 3 Car Attached Garage
- Garage Door Opener
Home Design
- Bi-Level Home
- Wood Siding
- Vinyl Siding
Interior Spaces
- Family Room
- Living Room
- Dining Room
- Home Office
- Dryer
Kitchen
- Dishwasher
- The kitchen features windows
Bedrooms and Bathrooms
- 3 Bedrooms
- 2 Full Bathrooms
Finished Basement
- Basement Fills Entire Space Under The House
- Basement Window Egress
Outdoor Features
- Deck
Utilities
- Forced Air Heating and Cooling System
- Water Softener is Owned
Community Details
- No Home Owners Association
- Village Hills Subdivision
Listing and Financial Details
- Assessor Parcel Number 208210001100
Map
Home Values in the Area
Average Home Value in this Area
Tax History
| Year | Tax Paid | Tax Assessment Tax Assessment Total Assessment is a certain percentage of the fair market value that is determined by local assessors to be the total taxable value of land and additions on the property. | Land | Improvement |
|---|---|---|---|---|
| 2024 | $3,542 | $362,100 | $82,800 | $279,300 |
| 2023 | $3,542 | $347,900 | $80,700 | $267,200 |
| 2022 | $3,252 | $347,700 | $80,600 | $267,100 |
| 2021 | $3,210 | $300,700 | $70,100 | $230,600 |
| 2020 | $2,982 | $292,500 | $66,800 | $225,700 |
| 2019 | $3,097 | $272,900 | $63,600 | $209,300 |
| 2018 | $2,876 | $264,600 | $60,600 | $204,000 |
| 2017 | $2,602 | $246,000 | $57,700 | $188,300 |
| 2016 | $2,464 | $220,600 | $55,000 | $165,600 |
| 2015 | $2,438 | $192,532 | $48,955 | $143,577 |
| 2014 | -- | $180,542 | $46,626 | $133,916 |
| 2013 | -- | $171,604 | $43,170 | $128,434 |
Property History
| Date | Event | Price | List to Sale | Price per Sq Ft |
|---|---|---|---|---|
| 10/23/2025 10/23/25 | Price Changed | $400,000 | -2.4% | $215 / Sq Ft |
| 10/10/2025 10/10/25 | For Sale | $410,000 | -- | $220 / Sq Ft |
Purchase History
| Date | Type | Sale Price | Title Company |
|---|---|---|---|
| Warranty Deed | $180,000 | Midwest Guaranty Title Compa | |
| Warranty Deed | $288,000 | -- | |
| Warranty Deed | $135,000 | -- |
Mortgage History
| Date | Status | Loan Amount | Loan Type |
|---|---|---|---|
| Previous Owner | $100,000 | New Conventional |
Source: NorthstarMLS
MLS Number: 6791210
APN: 20-82100-01-100
Disclaimer: Certain information contained herein is derived from information provided by parties other than Homes.com. All information provided is deemed reliable, but is not guaranteed to be accurate and should be independently verified.
![]() Based on information submitted to the MLS GRID. All data is obtained from various sources and may not have been verified by broker or MLS GRID. Supplied Open House Information is subject to change without notice. All information should be independently reviewed and verified for accuracy. Properties may or may not be listed by the office/agent presenting the information. Some IDX listings have been excluded from this website.
Based on information submitted to the MLS GRID. All data is obtained from various sources and may not have been verified by broker or MLS GRID. Supplied Open House Information is subject to change without notice. All information should be independently reviewed and verified for accuracy. Properties may or may not be listed by the office/agent presenting the information. Some IDX listings have been excluded from this website.
The Digital Millennium Copyright Act of 1998, 17 U.S.C. § 512 (the “DMCA”) provides recourse for copyright owners who believe that material appearing on the Internet infringes their rights under U.S. copyright law. If you believe in good faith that any content or material made available in connection with our website or services infringes your copyright, you (or your agent) may send us a notice requesting that the content or material be removed, or access to it blocked.
Notices must be sent in writing by email to DMCAnotice@MLSGrid.com.
The DMCA requires that your notice of alleged copyright infringement include the following information:
(1) description of the copyrighted work that is the subject of claimed infringement;
(2) description of the alleged infringing content and information sufficient to permit us to locate the content;
(3) contact information for you, including your address, telephone number and email address;
(4) a statement by you that you have a good faith belief that the content in the manner complained of is not authorized by the copyright owner, or its agent, or by the operation of any law;
(5) a statement by you, signed under penalty of perjury, that the information in the notification is accurate and that you have the authority to enforce the copyrights that are claimed to be infringed; and
(6) a physical or electronic signature of the copyright owner or a person authorized to act on the copyright owner’s behalf. Failure to include all of the above information may result in the delay of the processing of your complaint.
- 7996 Corey Path
- 8086 Dana Path
- 8104 Dana Path
- 8336 Cloman Ave
- 8355 Cooper Way
- 8381 Corcoran Cir Unit 49
- 3861 Conroy Trail
- 3944 76th Way E
- 7614 Connie Ln
- 7602 Connie Ln
- 8124 Clifford Cir
- 3295 80th St E Unit 508
- 8550 Corcoran Path
- 8590 Corcoran Path
- 4049 75th St E
- 8361 Carew Ct
- 7393 Clayton Ave
- 7344 Degrio Way
- 3080 Upper 76th St E
- 8827 Coffman Path
- 3760 75th St E
- 3085 Upper 76th St E
- 8213 College Trail
- 8851-8891 Broderick Blvd
- 1241 Mullan Ct
- 6043 Candace Ave
- 1462 80th St E
- 465 3rd Ave Unit Lower
- 680 6th St
- 5721-5733 Brent Ave
- 5818 Blackshire Path
- 5480 Blackberry Trail
- 251 Buron Ln
- 1209 8th Ave S Unit 1211
- 221 Buron Ln
- 8412 Grange Blvd
- 6997 Angela Trail
- 6848 Aqua Trail
- 6930 Angela Trail
- 1542 3rd Ave
