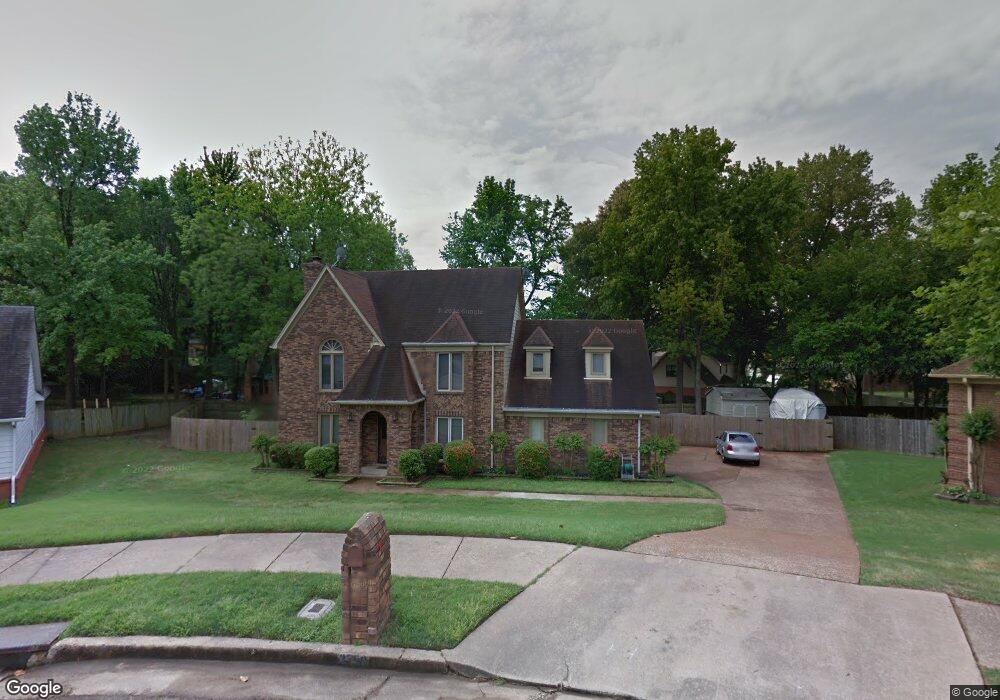
3750 Regency Oaks Cove Memphis, TN 38135
Estimated Value: $304,000 - $340,000
4
Beds
3
Baths
2,709
Sq Ft
$120/Sq Ft
Est. Value
About This Home
This home is located at 3750 Regency Oaks Cove, Memphis, TN 38135 and is currently estimated at $323,987, approximately $119 per square foot. 3750 Regency Oaks Cove is a home located in Shelby County with nearby schools including Bartlett Elementary School, Elmore Park Middle School, and Bartlett High School.
Ownership History
Date
Name
Owned For
Owner Type
Purchase Details
Closed on
Jul 14, 2006
Sold by
Whitehorn Jeffrey T and Whitehorn Paul B
Bought by
Krueger Christopher J and Krueger Linda L
Current Estimated Value
Home Financials for this Owner
Home Financials are based on the most recent Mortgage that was taken out on this home.
Original Mortgage
$143,600
Outstanding Balance
$84,733
Interest Rate
6.54%
Mortgage Type
New Conventional
Estimated Equity
$239,254
Purchase Details
Closed on
May 30, 2002
Sold by
Whitehorn Judy P
Bought by
Whitehorn Paul Thomas
Create a Home Valuation Report for This Property
The Home Valuation Report is an in-depth analysis detailing your home's value as well as a comparison with similar homes in the area
Home Values in the Area
Average Home Value in this Area
Purchase History
| Date | Buyer | Sale Price | Title Company |
|---|---|---|---|
| Krueger Christopher J | $179,500 | None Available | |
| Whitehorn Paul Thomas | -- | -- |
Source: Public Records
Mortgage History
| Date | Status | Borrower | Loan Amount |
|---|---|---|---|
| Open | Krueger Christopher J | $143,600 |
Source: Public Records
Tax History Compared to Growth
Tax History
| Year | Tax Paid | Tax Assessment Tax Assessment Total Assessment is a certain percentage of the fair market value that is determined by local assessors to be the total taxable value of land and additions on the property. | Land | Improvement |
|---|---|---|---|---|
| 2025 | $1,998 | $77,225 | $17,000 | $60,225 |
| 2024 | $1,998 | $58,950 | $12,075 | $46,875 |
| 2023 | $3,018 | $58,950 | $12,075 | $46,875 |
| 2022 | $3,018 | $58,950 | $12,075 | $46,875 |
| 2021 | $3,065 | $58,950 | $12,075 | $46,875 |
| 2020 | $2,525 | $42,950 | $10,450 | $32,500 |
| 2019 | $2,525 | $42,950 | $10,450 | $32,500 |
| 2018 | $2,525 | $42,950 | $10,450 | $32,500 |
| 2017 | $1,765 | $42,950 | $10,450 | $32,500 |
| 2016 | $1,791 | $40,975 | $0 | $0 |
| 2014 | $1,791 | $40,975 | $0 | $0 |
Source: Public Records
Map
Nearby Homes
- 3726 Old Creek Cove
- 3781 Adina Dr
- 6138 Gailyn Cove
- 3755 Hawks Hollow Cove
- 6353 Thistle Point
- 6346 Eagle Valley Cove
- 3831 Westridge Dr
- 3605 Burkehill Dr
- 3593 Gillia Cir W
- 5999 Pebblehill Dr
- 3540 Thistle Valley Ln
- 3505 Evening Light Dr
- 3452 Venson Dr
- 6495 Birch Mill Rd
- 6360 Fairway View Cove
- 3430 Morning Light Dr
- 6105 Scottscraig Cove
- 6339 Fairway Hill Cove
- 6884 Talcott Ln
- 6886 Talcott Ln
- 3734 Old Creek Cove
- 3754 Regency Oaks Cove
- 3753 Regency Oaks Cove
- 3730 Old Creek Cove
- 3729 Old Creek Cove
- 3762 Regency Oaks Cove
- 3745 Oak Bark Ln
- 3748 Oak Forest Dr
- 3737 Oak Bark Ln
- 3758 Oak Forest Dr
- 3738 Oak Forest Dr
- 3755 Oak Bark Ln
- 3723 Old Creek Cove
- 3771 Regency Oaks Cove
- 3764 Oak Forest Dr
- 3729 Oak Bark Ln
- 3787 Oak Bark Ln
- 3726 Oak Forest Dr
- 3718 Old Creek Cove