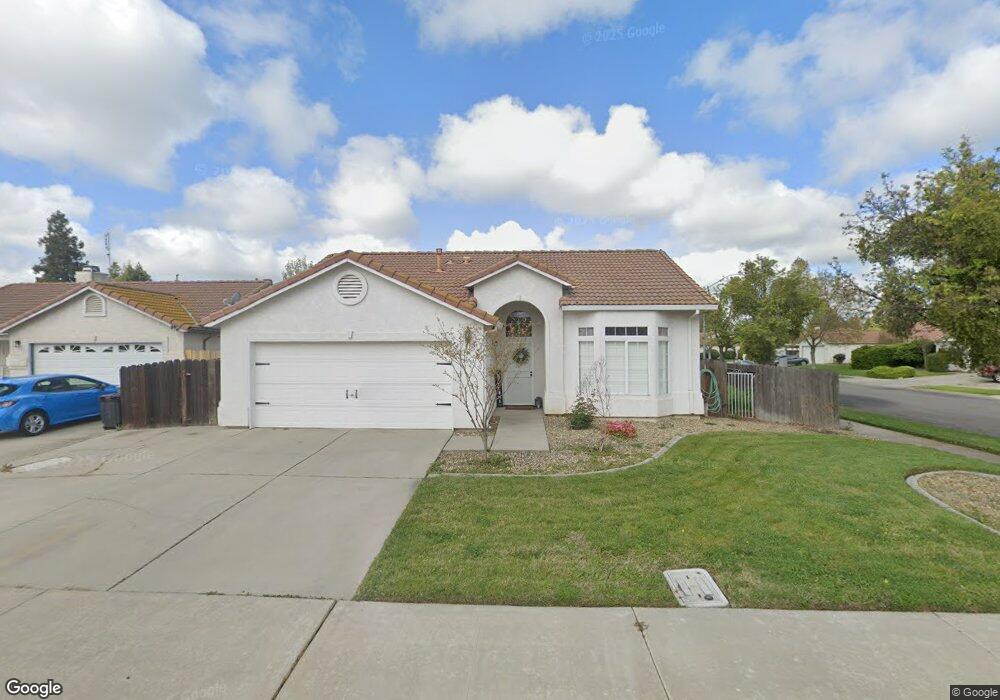
3751 Pheasant Ct Merced, CA 95340
Estimated Value: $393,899 - $411,000
3
Beds
2
Baths
1,487
Sq Ft
$270/Sq Ft
Est. Value
About This Home
This home is located at 3751 Pheasant Ct, Merced, CA 95340 and is currently estimated at $401,475, approximately $269 per square foot. 3751 Pheasant Ct is a home located in Merced County with nearby schools including Allan Peterson Elementary School, Herbert H. Cruickshank Middle School, and El Capitan High School.
Ownership History
Date
Name
Owned For
Owner Type
Purchase Details
Closed on
Jul 2, 2012
Sold by
Treso Edith and Frank Treso & Edith Treso 2005
Bought by
Treso Treso Edith Edith and Treso Frank
Current Estimated Value
Purchase Details
Closed on
Aug 29, 2005
Sold by
Treso Ferenc and Treso Edith
Bought by
Treso Frank and Treso Edith
Purchase Details
Closed on
Aug 18, 2003
Sold by
Mogrovejo Roberto
Bought by
Treso Ferenc and Treso Edith
Home Financials for this Owner
Home Financials are based on the most recent Mortgage that was taken out on this home.
Original Mortgage
$115,000
Outstanding Balance
$44,902
Interest Rate
4.07%
Mortgage Type
Negative Amortization
Estimated Equity
$356,573
Purchase Details
Closed on
Jan 7, 1999
Sold by
Cazares Gloria E
Bought by
Mogrovejo Roberto
Home Financials for this Owner
Home Financials are based on the most recent Mortgage that was taken out on this home.
Original Mortgage
$47,055
Interest Rate
6.77%
Create a Home Valuation Report for This Property
The Home Valuation Report is an in-depth analysis detailing your home's value as well as a comparison with similar homes in the area
Purchase History
| Date | Buyer | Sale Price | Title Company |
|---|---|---|---|
| Treso Treso Edith Edith | -- | None Available | |
| Treso Frank | -- | -- | |
| Treso Ferenc | $225,000 | Fidelity Title Company | |
| Mogrovejo Roberto | -- | Fidelity National Title Co | |
| Mogrovejo Roberto | $125,000 | Fidelity National Title Co |
Source: Public Records
Mortgage History
| Date | Status | Borrower | Loan Amount |
|---|---|---|---|
| Open | Treso Ferenc | $115,000 | |
| Previous Owner | Mogrovejo Roberto | $47,055 |
Source: Public Records
Tax History
| Year | Tax Paid | Tax Assessment Tax Assessment Total Assessment is a certain percentage of the fair market value that is determined by local assessors to be the total taxable value of land and additions on the property. | Land | Improvement |
|---|---|---|---|---|
| 2025 | $3,530 | $319,886 | $99,515 | $220,371 |
| 2024 | $3,530 | $313,614 | $97,564 | $216,050 |
| 2023 | $3,473 | $307,465 | $95,651 | $211,814 |
| 2022 | $3,421 | $301,437 | $93,776 | $207,661 |
| 2021 | $3,408 | $295,528 | $91,938 | $203,590 |
| 2020 | $3,422 | $292,499 | $90,996 | $201,503 |
| 2019 | $3,371 | $286,764 | $89,212 | $197,552 |
| 2018 | $2,887 | $262,500 | $55,000 | $207,500 |
| 2017 | $2,879 | $247,500 | $45,000 | $202,500 |
| 2016 | $2,704 | $231,000 | $45,000 | $186,000 |
| 2015 | $2,642 | $227,000 | $45,000 | $182,000 |
| 2014 | $2,318 | $197,000 | $30,000 | $167,000 |
Source: Public Records
Map
Nearby Homes
- 3632 Swan Ct
- 1126 Sprig Ct
- 3882 Pintail Ct
- 3692 N Gardner Ave
- 3951 Black Hawk Ct
- 3877 Pintail Ct
- 0 Dunn Rd Unit MC25278439
- 0 Dunn Rd Unit MC25278437
- 1427 Caraway Ct
- 3947 Finch Ct
- 1143 Brownie Ct
- 724 Robin Dr
- 1862 Dunn Rd
- 945 Gazelle Ct
- 692 Gateway Cir
- 1833 La Quinta Ct
- 1048 Vernal Ave
- 1276 Panorama Point Ct
- 591 Bobolink Ct Unit 2
- 1787 Edgewood Ct
- 3741 Pheasant Ct
- 3752 Chukar Ct
- 3748 Chukar Ct
- 1453 Hunters Dr
- 3733 Pheasant Ct
- 3750 Pheasant Ct
- 1443 Hunters Dr
- 3746 Pheasant Ct
- 3738 Pheasant Ct
- 3744 Chukar Ct
- 1473 Hunters Dr
- 1433 Hunters Dr
- 3742 Pheasant Ct
- 1483 Hunters Dr
- 3747 Chukar Ct
- 1457 Partridge Dr
- 3757 Pigeon Ct
- 3749 Pigeon Ct
- 1447 Partridge Dr
- 3740 Chukar Ct
Your Personal Tour Guide
Ask me questions while you tour the home.