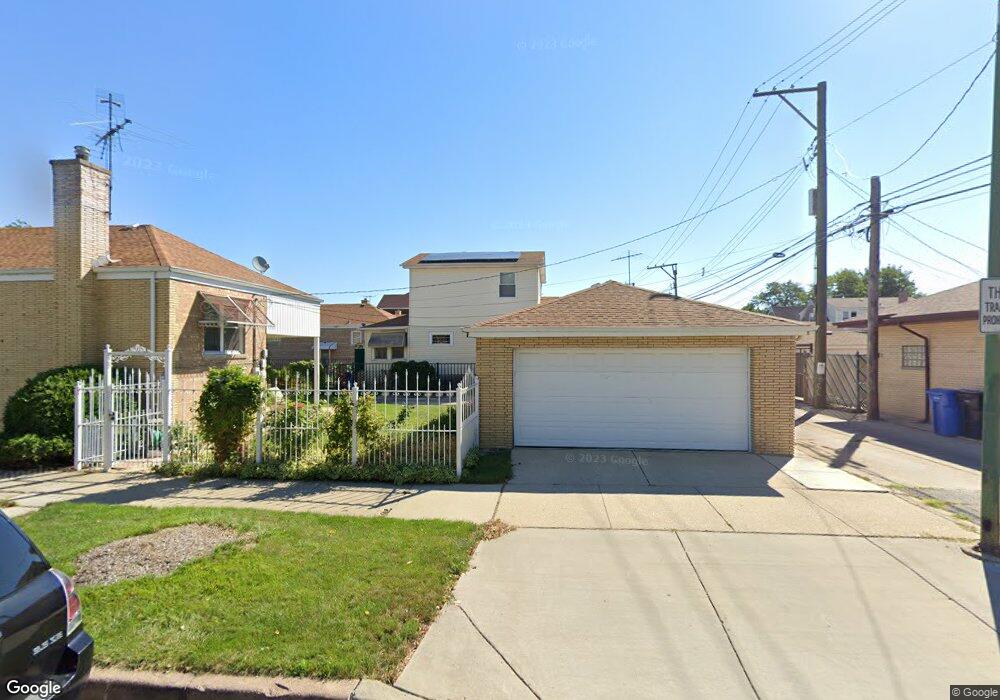
3751 W 66th Place Chicago, IL 60629
West Lawn NeighborhoodEstimated Value: $287,000 - $338,000
3
Beds
2
Baths
1,458
Sq Ft
$219/Sq Ft
Est. Value
About This Home
This home is located at 3751 W 66th Place, Chicago, IL 60629 and is currently estimated at $319,899, approximately $219 per square foot. 3751 W 66th Place is a home located in Cook County with nearby schools including Eberhart Elementary School, Hubbard High School, and Queen of the Universe School.
Ownership History
Date
Name
Owned For
Owner Type
Purchase Details
Closed on
Apr 8, 2005
Sold by
Saramiento Raul and Saramiento Maria
Bought by
Hernandez Patricia
Current Estimated Value
Home Financials for this Owner
Home Financials are based on the most recent Mortgage that was taken out on this home.
Original Mortgage
$148,454
Outstanding Balance
$86,599
Interest Rate
7.85%
Mortgage Type
Fannie Mae Freddie Mac
Estimated Equity
$233,300
Purchase Details
Closed on
Nov 28, 2001
Sold by
Sarmiento Raul and Sarmiento Mauricia
Bought by
Sarmiento Raul and Sarmiento Maria M
Home Financials for this Owner
Home Financials are based on the most recent Mortgage that was taken out on this home.
Original Mortgage
$88,661
Interest Rate
6.6%
Mortgage Type
FHA
Purchase Details
Closed on
Feb 9, 1995
Sold by
Metropolitan Bank & Trust Company
Bought by
Sarmiento Raul and Sarmiento Mauricia
Home Financials for this Owner
Home Financials are based on the most recent Mortgage that was taken out on this home.
Original Mortgage
$74,949
Interest Rate
9.21%
Mortgage Type
FHA
Create a Home Valuation Report for This Property
The Home Valuation Report is an in-depth analysis detailing your home's value as well as a comparison with similar homes in the area
Home Values in the Area
Average Home Value in this Area
Purchase History
| Date | Buyer | Sale Price | Title Company |
|---|---|---|---|
| Hernandez Patricia | $186,000 | -- | |
| Sarmiento Raul | -- | -- | |
| Sarmiento Raul | $75,000 | Ticor Title |
Source: Public Records
Mortgage History
| Date | Status | Borrower | Loan Amount |
|---|---|---|---|
| Open | Hernandez Patricia | $148,454 | |
| Previous Owner | Sarmiento Raul | $88,661 | |
| Previous Owner | Sarmiento Raul | $74,949 | |
| Closed | Hernandez Patricia | $37,113 |
Source: Public Records
Tax History Compared to Growth
Tax History
| Year | Tax Paid | Tax Assessment Tax Assessment Total Assessment is a certain percentage of the fair market value that is determined by local assessors to be the total taxable value of land and additions on the property. | Land | Improvement |
|---|---|---|---|---|
| 2024 | $4,176 | $24,000 | $3,600 | $20,400 |
| 2023 | $4,050 | $23,000 | $4,500 | $18,500 |
| 2022 | $4,050 | $23,000 | $4,500 | $18,500 |
| 2021 | $3,955 | $23,000 | $4,500 | $18,500 |
| 2020 | $3,248 | $17,586 | $4,500 | $13,086 |
| 2019 | $3,302 | $19,760 | $4,500 | $15,260 |
| 2018 | $3,246 | $19,760 | $4,500 | $15,260 |
| 2017 | $2,216 | $13,600 | $4,050 | $9,550 |
| 2016 | $2,238 | $13,600 | $4,050 | $9,550 |
| 2015 | $2,026 | $13,600 | $4,050 | $9,550 |
| 2014 | $1,955 | $13,024 | $3,825 | $9,199 |
| 2013 | $1,906 | $13,024 | $3,825 | $9,199 |
Source: Public Records
Map
Nearby Homes
- 3709 W 66th Place
- 3624 W 66th Place
- 3907 W Marquette Rd
- 3757 W 65th St
- 3920 W Marquette Rd
- 3604 W 65th Place
- 3651 W 64th Place
- 3814 W 69th St
- 3555 W 65th Place
- 3624 W 69th St
- 3814 W 69th Place
- 3631 W 69th St
- 3751 W 63rd Place
- 3736 W 70th St
- 3439 W 66th Place
- 3617 W 63rd Place
- 3408 W Marquette Rd
- 3529 W 63rd Place
- 3700 W 63rd St
- 3914 W 63rd St Unit 3B
- 3749 W 66th Place
- 3759 W 66th Place
- 3759 W 66th Place
- 3745 W 66th Place
- 3741 W 66th Place
- 3741 W 66th Place
- 3752 W Marquette Rd
- 3750 W Marquette Rd
- 3750 W Marquette Rd
- 3801 W 66th Place
- 3756 W Marquette Rd
- 3746 W Marquette Rd
- 3742 W Marquette Rd
- 3805 W 66th Place
- 3735 W 66th Place
- 3740 W Marquette Rd
- 3754 W 66th Place
- 3750 W 66th Place
- 3758 W 66th Place
- 3748 W 66th Place